And Heat Transfer Measurements
Campbell et al. (1998) developed a heat transfer measurement technique by combing TSP and a laser spot heating unit into a single non-intrusive system. After an infrared laser was used to generate a local heat flux into a surface,
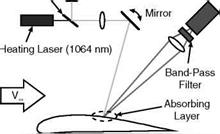
convection heat transfer was determined from the surface temperature response measured using TSP. Figure 10.23 is a general layout of the laser spot heating heat transfer system with TSP (LSH-TSP) that consisted of three sub-systems, one for temperature measurement and two for surface heating. The temperature measurement system was composed of an excitation laser, TSP, a band-pass filter and a photo-detector (PMT). The role of the temperature measurement subsystem was to measure the luminescent intensity and thus the surface temperature at a target point. The heating system was composed of a heating laser, an insulating layer and an absorbing layer, which created a local heat flux to the surface that was necessary to make heat transfer measurements. Note that Mayer et al. (1997) proposed a similar technique that used laser heating and an IR camera (rather than TSP) for wall-shear stress measurements based on the relationship between local heat transfer and shear stress.
The temperature measurement sub-system was very similar to the laser scanning TSP system. A solid-state, diode pumped Nd:YLF laser with a frequency doubling crystal produced a 50-mW beam at 532 nm, which served as an excitation source for TSP. This beam was reflected off of a glass slide to reduce the power to approximately 2 mW. Excitation of TSP at this power level resulted in a significant luminescent signal while preventing excessive photodegradation of TSP by the excitation laser. The excitation beam was focused at a point of interest on the model surface. The luminescent emission from TSP was gathered by a collection lens and focused through a band-pass filter to a PMT. The PMT detected the luminescent intensity of TSP that was then converted to temperature using a priori TSP calibration relation. The heating subsystem was composed of a solid-state, diode pumped Nd:YLF laser which produced a 200-mW beam at 1064 nm (infrared) and optics to direct the beam at the surface. This wavelength was much longer than both the absorption and emission bands of a Ru(bpy)-based TSP used in their research, and any reflected IR radiation was effectively filtered by a band-pass filter. This beam was focused onto the absorbing layer on the surface that absorbed the radiation and heated up.
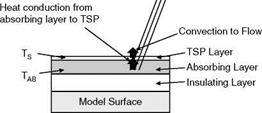
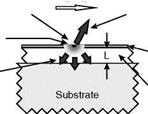
The absorbing layer was another important element of this system. Figure 10.24 shows an idealized model surface that was first coated with an insulator and then a thin absorbing layer. The material of the absorbing layer absorbed radiation from the heating laser, causing the temperature of the absorbing layer to rise. The temperature gradient between the absorber and the TSP layer on the top resulted in heat conduction from the absorber to TSP. The heat generated in the absorbing layer and conducted through TSP was released through convection heat transfer at the TSP surface. Two absorbing layers were investigated. The first was a dark surface that absorbed IR radiation simply due to its color. Several dark surfaces such as fine-grit polishing paper and magnetic tape proved to work well as an absorber. The second option was an IR dye (IR26 from Lambdachrome Laser Dyes) that absorbed strongly at 1 |jm. A small portion of the absorbed energy was re-emitted at a longer wavelength, but the majority of the energy went into heating up the absorbing layer. The laser dye can be mixed with a polymer applied as a separate layer, or mixed directly with TSP. Since adding the IR dye to TSP did not change the temperature sensitivity of TSP and it also simplified coating process, this option was chosen in their experiments.
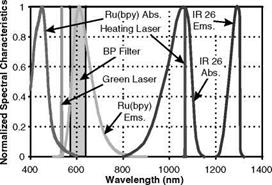
As shown in Fig. 10.23, the excitation and heating lasers were combined into a single, co-linear beam using a glass slide. The combined beam was focused at a target location on the model surface using a single lens. Since the optical path length between the focusing lens and the model surface varied during experiments, the optical system was designed with a large depth of field. In practice, alignment of the two spots over the whole surface of interest was ensured through visual inspection of a scan grid. Figure 10.25 shows the spectral arrangement of the components of the LSH-TSP system. The emission spectra of the lasers and IR dye did not overlap with the emission spectrum of the Ru(bpy)- based TSP.
![]()
![]()
![]()
![]()
![]()

 П
П
![]()
|
|
|||
|
|||
|
|||
|
|||
|
![]()
|
|
|
|
|
|
|
|
|
|
|
In order to determine the convection heat transfer coefficient hc, the surface was first heated to a steady state and then the surface temperature response was recorded after the heating laser was turned off. The natural log of the nondimensional temperature was plotted versus time and the slope of the resulting curve was evaluated using the following relation
(10.2)
The slope was a sum of two terms: the time constant Th that was a function of the heat transfer coefficient hc and the heat conduction term C. The conduction term C was experimentally determined for a given test configuration by making flow – off measurements. In such a case, the convection heat transfer due to natural convection was several orders of magnitude lower than the heat conduction into the model surface. Hence, the surface temperature response gave the conduction term at a location, and the heat conduction term was equal to the log-slope of the non-dimensional temperature response for a flow-off scan. This value was used to adjust the log-slope of flow-on scan data to account for the heat conduction effect.
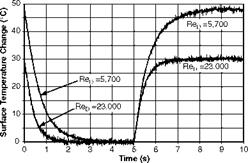
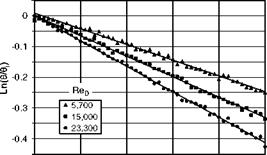
According to the transient model, higher heat transfer would be expected to produce a small time constant Th. Figure 10.27 shows typical responses of the surface temperature to a pulsed laser heating at two different Reynolds numbers in an impinging jet. The steady-state temperature was higher at lower Reynolds numbers due to lower convection heat transfer. At higher Reynolds numbers, the steady state was reached much sooner and the time constant was smaller due to higher convention heat transfer. Figure 10.28 shows the natural log of the nondimensional temperature response в/ ві for the first 0.5 seconds of the cooling cycle. The log-plots exhibited a linear behavior and the increased slope (the absolute value) with the Reynolds number, and demonstrated the sensitivity of the slope to the heat transfer rate. In preliminary tests, using the LSH-TSP system, Campbell et al. (1998) measured the Nusselt number distributions in an impinging jet at different Reynolds numbers and gave reasonable results.
|
Fig. 10.27. Surface temperature response to pulsed laser heating in an impinging jet. From Campbell et al. (1998) |
|
0 0.1 0.2 0.3 0.4 0.5 Time (s) Fig. 10.28. Natural log-plot of the non-dimensional surface temperature response at three Reynolds numbers in an impinging jet. From Campbell et al. (1998) |
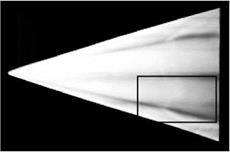
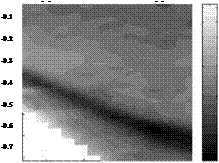
Campbell et al. (1998) presented application of the LSH-TSP system to more complex flows. Quantitative measurements were made on a 75o swept delta wing model using the LSH-TSP system in a region that was also visualized by TSP with a CCD camera at the same conditions, as shown in Fig. 10.29a. Figure 10.29b shows a map of the heat transfer coefficient hc in this region at the angle of attack of 25o. Another experiment was performed for quantitative heat transfer
measurements in an intersection of a strut and a wall that often occurred in air vehicles (e. g. the wing/body and stator/wall junction). Figure 10.30 shows schematically the primary horseshoe vortex developed around the base of a strut that influences the heat transfer distribution on the wall. A strut with a NACA 0015 airfoil cross-section and a 48-in chord was positioned vertically in the Boeing subsonic wind tunnel at Purdue University and it spanned the 48-in height of the test section. The flow velocity was about 90 ft/s and the Reynolds number
was about 2.5 millions based on the chord. Another relevant length scale for this flow was the strut thickness of 7.2 in, and the Reynolds number based on it was about 350,000. The LSH-TSP system was used to measure the heat transfer rate on the large model in a large wind tunnel since heating the entire wall would be impractical. Figure 10.31 shows a map of the Stanton number on the surface around the strut. The heat transfer results were computed using the transient heat transfer model with heat conduction correction. The location on the surface was normalized by the approaching boundary layer displacement thickness S* = 0.5 in. The largest variation in heat transfer appeared near the leading edge of the strut. There was a region of decreased heat transfer due to decelerating flow and local flow separation caused by the presence of the strut. Near the strut, heat transfer was enhanced by the primary horseshoe vortex that transported fluid outside the boundary layer to the wall.

![]()
 |
||
(a)


