Shock/Boundary-Layer Interaction
Liu et al. (1995a) used EuTTA-dope TSP to measure the heat transfer rate in several typical shock/turbulent-boundary-layer interacting flows: swept-
shock/boundary-layer interaction, flows over rearward – and forward-facing steps, and incident shock/boundary-layer interaction. TSP allowed quantitative measurements of heat transfer in complex 3D separated flows induced by shock/boundary-layer interaction. The experiments were carried out in a blowdown supersonic wind tunnel with a test cross-section of 44×56 mm at Purdue University. The test models were mounted on the floor of the test section that was about 33 cm downstream of the nozzle throat. The tests were performed at Mach 2.5, the total pressure of 2.9 atm. and the total temperature of 295 K. The incoming boundary layer on the floor of the test section was fully turbulent. The incoming turbulent boundary-layer thickness (S) in the test section was about 4.6 mm and the Reynolds number ReS based on it was 1.3×10⁵. A thin insulating layer covered the aluminum test section floor and surface of aluminum models that were thermally attached to the floor using high thermal conductivity grease. The insulating layer was composed of a 0.07-mm thick Scotch brand packing tape and 0.05-mm thick white Mylar film. TSP was applied on the surface of the white insulating layer. The purpose of using the insulating layer was two-fold. First, light scattering from the white layer significantly enhanced the luminescent intensity viewed by a camera. Secondly, the thin insulating layer produced a sufficient temperature difference across it such that a simple data reduction model could be used to calculate the heat transfer rate. Two UV lamps were used to excite the paint. A steady-state heat transfer model was used to calculate the heat flux qs from the measure surface temperature, and then the Stanton number St = qs/p„u„cp(Taw – Ts) was
evaluated, where p«, and u^ are the freestream density and velocity of air flow, respectively, cp is the specific heat of air at a constant pressure, and Taw is the adiabatic wall temperature.
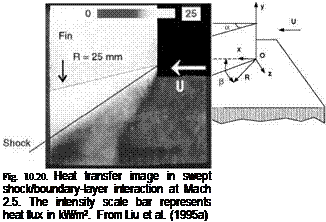
An example was swept-shock/turbulent-boundary-layer interaction. As shown in Fig. 10.19, an attached planar shock generated by a sharp fin interacted with the incoming turbulent boundary layer on the floor, which produced complicated 3D flow separation. Previously, Settles and Lu (1985) suggested that except in the inception region near the leading edge of the fin, local physical quantities such as pressure and heat transfer rate on the floor approached a quasi-conical symmetrical state in which these quantities remained invariant along a ray from a virtual conical origin. Several heat transfer measurements were made in the quasiconical symmetry region using conventional heat transfer sensors distributed discretely along a fixed arc (Lee and Settles 1992; Rodi and Dolling 1992). Here, TSP was used to obtain a global heat transfer map in the inception region where the flow lacked the presumed quasi-conical symmetry and the heat transfer rate significantly changed along the radial direction. Figure 10.20 shows a typical heat transfer image in the inception region of the 10o fin at M= 2.5 and Res = 1.3×10⁵. In the image, bright and dark regions correspond to high and low heat transfer, respectively, and the intensity scale bar represents the heat transfer flux in kW/m2. The viewing polar angle of the camera was about 60o. The arrow indicates the
incoming flow direction and the length of the arrow in the image corresponds to 10 mm in the actual length scale in the streamwise direction.
 |
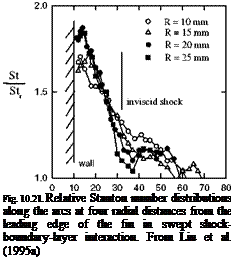
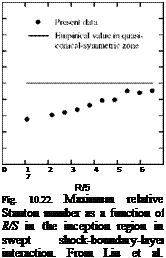
The primary separation line was identified, and the highest heat transfer region was located in the neighborhood of the fin. Figure 10.21 presents the distributions of the relative Stanton number St/Str along four circular arcs with different radial distance R from the leading edge of the fin, where Str is the reference Stanton number in the undisturbed boundary layer upstream of the leading edge. As R increased, the distributions of the heat transfer rate tended to approach an asymptotic profile near the fin while the asymptotic tendency was not quite evident near the inviscid shock location. When the maximum relative Stanton number StmJStr was taken as a characteristic quantity, as shown in Fig. 10.22, it was found that StnaJSt r increased with the non-dimensional radial distance R/S and approached the value measured previously using thin-film sensors by Lee and Settles (1992) in the quasi-conical symmetry region. Therefore, the asymptotic behavior of the heat transfer rate measured by TSP in the inception region supported the concept of the quasi-conical symmetry. Heat transfer measurements were also made using TSP for other shock/boundary-layer interactions such as rearward and forward facing steps and incident shock/boundary-layer interaction; comparisons of TSP measurements with previous results obtained by conventional techniques for these flows were discussed by Liu et al. (1995a).

![]()

P (degree)


