SOME CONCLUSIONS ABOUT PANEL METHODS
The examples presented in this chapter indicate that most methods can yield reasonable results. The methods were presented in their simplest form and their computational efficiency usually can be improved. For example, when calculating the influence of the panels, terms that depend on panel cornerpoint geometry are calculated twice (for each of the neighbor panels) and this redundancy can easily be corrected in the computer programming phase.
It seems that in terms of ease of construction and the least computational effort the constant-strength doublet method with the internal velocity potential boundary condition is the most successful. Also, in general, the use of the velocity potential boundary condition will result in less numerical manipulations and hence less computational time.
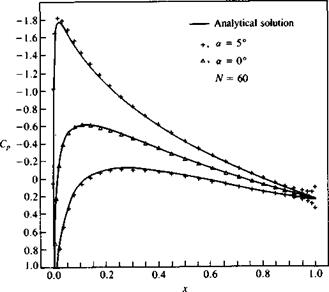
The use of higher-order methods requires more computational effort and is justified when the velocity near the body must be continuous (as inside the gaps of multielement airfoils). However, constant-strength singularity element based methods can give good results, too, when a sufficient number of panels are used (see Fig. 11.28).
All of the methods presented for the solution of lifting flows can be extended to include several bodies (or airfoils) and then for each element a separate Kutta condition is used. As an example, the chordwise pressure distribution along a four-element airfoil is presented in Fig. 11.33. The
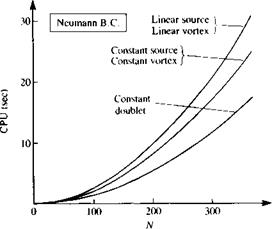 |
FIGURE 11.36
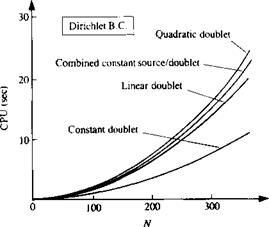
Comparison of computational time (CPU, in seconds for VAX-6000-320 computer) between the various panel methods, versus number of panels.
computation was done with a linear-strength source and doublet combination using the internal Dirichlet boundary condition.
Most of the methods presented here were investigated in Ref. 11.1 and the computation times (CPU—measured in seconds for the VAX-6000-320 computer) versus number of panels N is presented in Fig. 11.36. In this data the matrix inversion time (which has the same order of magnitude) was subtracted in order to increase the resolution in the figure. This indicates that the constant doublet method with the Dirichlet boundary condition is the fastest, and computational effort increases with increasing order of the method (however, it seems that low – and higher-order methods can converge to solutions of similar quality in terms of circulation and lift with a similar number of panels).
It is noted, too, that each computational method depends on the grid and on various other parameters. Therefore, each technique must be validated first
|
c FIGURE 11.37 Effect of panel density on the computed pressure distribution, using very few panels (linear doublet method with the Dirichlet B. C.). |
before it can be applied to unknown cases. As an example, the sensitivity of the linear doublet (with the internal Dirichlet boundary condition) to panel density is presented in Fig. 11.37. The very low density of 5 upper and 5 lower panels resulted in a crude solution, which improved considerably by doubling the number of panels. When panel density was increased to 70, results similar to those presented in Fig. 11.31 were obtained.
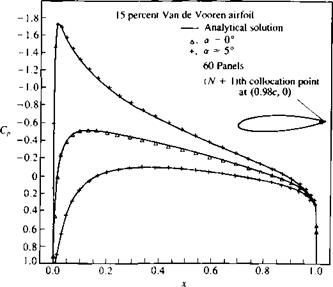
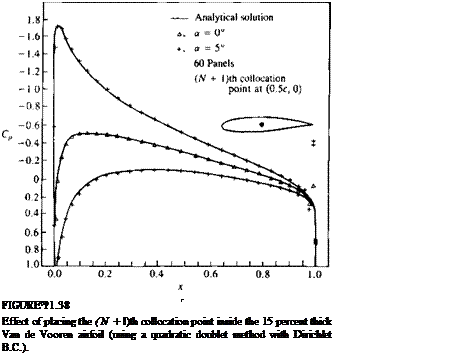
Another example for the sensitivity of the methods to geometrical details is presented in Fig. 11.38. Here the (N + l)th collocation point for the quadratic doublet (with Dirichlet B. C.) is moved inside the airfoil. In Fig. 11.38a this collocation point is placed near the trailing edge and the results for both a – 0° and 5° are good. (Bringing this point too close to the trailing edge panel collocation points, though, may cause the matrix to be ill-conditioned for large panel numbers.) But if this point is placed at the center of the airfoil (as shown in Fig. 11.386) the results near the trailing edge become erratic.
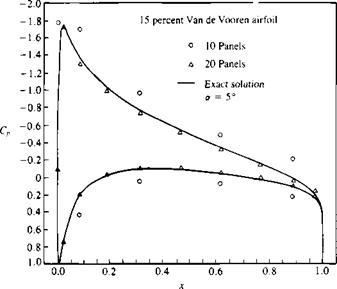
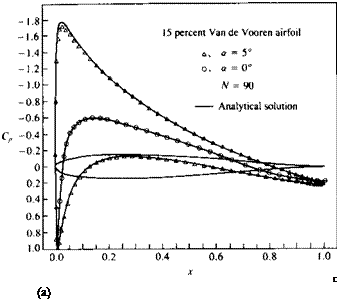
Another interesting problem arises when attempting to model airfoils with cusped (very thin) trailing edges. The geometry of such an airfoil is presented in the inset to Fig. 11.39a, and more information on this 15 percent thick airfoil is provided in Sections 6.6 and 6.7. Most methods will have problems near the trailing edge because of the very tight placing of the collocation points. This is illustrated in Fig. 11.396, where the data was calculated with a constant strength source/doublet method using the Dirichlet
![]()
 |
 |
|
|
B. C. Such problems can be cured by modeling a finite angle there (instead of zero angle) and this can be achieved by simply having larger trailing edge panels. The linear-strength vortex method with the Neumann B. C. seemed to be the only method that was not sensitive to this cusped trailing edge problem (see Fig. 11.39a).
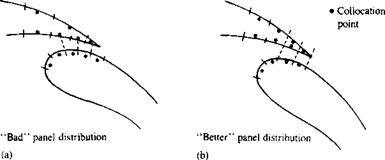
In conclusion, most methods will work and can be tailored to particular needs, and in many cases problems can be avoided by simple means such as selecting a better spacing of the panels. As a final example, to enforce this statement, consider the panel distribution inside the gap of a two-element airfoil, as shown in Fig. 11.40a. Since the lower surface collocation points are close to the panel cornerpoints the influence of this panel can be overestimated (e. g., in the case of a vortex being at the panel corner point). A simple rearrangement of the panels, as shown in Fig. 11.40b, can improve the solution in this area.
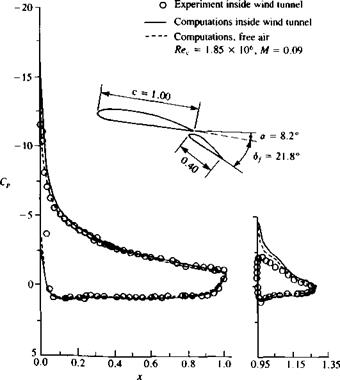
Finally, before concluding this chapter we must note that the present analysis is based on potential flow theory and, for example, the calculated drag coefficient is zero. However, the viscous boundary layer does result in certain values of drag coefficient (even at zero lift) and a large selection of such information is provided by Abbot and Doenhoff11 2 The effect of viscosity on the pressure distribution (for the smaller angles of attack) is usually small but at larger angles of attack due to flow separation the pressure distribution may change considerably (for more details see Chapter 14). As an example, the calculated (by a constant strength doublet-source method with Dirichlet B. C.) and experimental pressure distribution on a NACA 4412 airfoil with a NACA 4415 flap are presented in Fig. 11.41. In this condition the airfoil is near stall; that is, the flow on the front airfoil is attached and on the flap a limited trailing edge separation is present. Near the leading edge the calculated suction peak is larger than the experimental data and on the flap it is considerably less because of the trailing edge separation. Also, in general, even for the attached flow case the experimental circulation is slightly less as indicated by the comparison
|
FIGURE 11.40 Recommended and not recommended options for panel distributions inside the gap of a two-element airfoil. |
|
C FIGURE 11.41 Two-dimensional experimental and computed (constant source/doublet method, with Dirichlet B. C.) chordwise pressure distribution on a NACA 4412 wing and a NACA 4415 flap (flap chord is 40 percent of wing chord). Experiments from Adair, D. and Horne, W. C., “Turbulent Separated Flow in the Vicinity of a Single-Slotted Airfoil Flap,” AIAA Paper 88-0613, Jan. 1988. |


