Estimating the climb performance
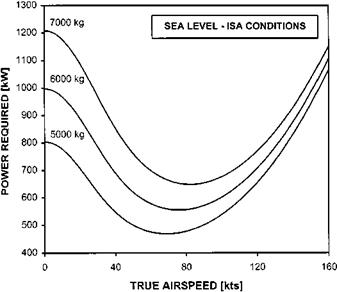
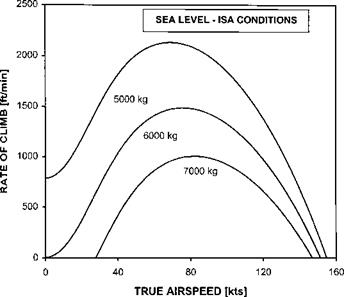
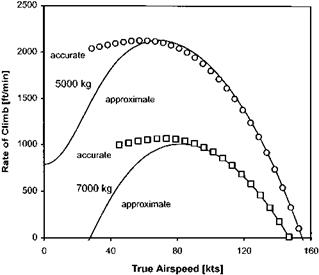
The accuracy of this approximation can be verified by an example. Consider a helicopter operating at SL-ISA with a 6.5 m radius 4-bladed rotor of 0.4 m chord. If the horizontal drag area is 2 m2 and the main rotor profile drag coefficient is 0.01 the variation of PFLF with TAS and AUM will be as shown in Fig. 3.26. Suppose the maximum power available under SL-ISA conditions is 1 MW. Then from Equation (3.3) the variation of RoC with TAS and AUM can be determined with relative ease, see Fig. 3.27. Comparing this approximate method with the results from a fuller approach (Fig. 3.28) shows that the two are in close agreement for airspeeds in excess of ^мр.
3.6.1.1 Problems with wasted power
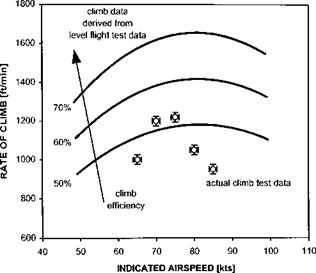
Using data from flight tests (see Fig. 3.29) it is clear that estimating climb performance from level flight data is not straightforward in practice. The difficulty lies in determining
|
Fig. 3.26 Variation of power for level flight with AUM. |
|
Fig. 3.27 Variation of RoC with TAS and AUM. |
the percentage of excess power that is available as climb power. For an accurate estimate it is necessary to determine the precise amount of power wasted through transmission losses and in generating the extra anti-torque force needed as a consequence of the greater collective pitch applied to the main rotor. The simplest
|
Fig. 3.28 Estimates of climb performance. |
|
Fig. 3.29 Estimates of climb performance based on level flight data. |
approach of assuming that all the excess power available is taken up as climb power will typically lead to an overestimate of the actual rate of climb, although the speed for best rate of climb will usually be predicted quite accurately. More accurate estimates of climb performance can be made by incorporating the concept of a climb efficiency factor (pc) [3.8]:
mg


