Measuring climb performance
In the case of partial climbs ground effect is not considered and the parameter m/f Q cannot be controlled since the outside air temperature changes as the rotorcraft climbs. Therefore, the familiar power required relationship can be written as:
V = J_P. W V
m 8 VQ, 5 , m)
V = J_P_ _W Л m lam3 ’ cm2’ m I
The equations can be re-written in an alternative form introducing a power-to- weight ratio:
V = f(_L_ W Л
m WVQ ’ 5 , m)
V = J_P_ _W Л
m Wm’ am2’ m I
3.6.1 Flight test techniques
The main problem with using an ‘experimental’ approach to reducing climb performance data is the difficulty associated with maintaining the relevant referred parameters constant. It is therefore common practice to use test day conditions and refer the data afterwards, if required, rather than target specific combinations of referred parameters during the testing itself. There are two techniques that may be adopted to minimize the effect of reducing aircraft mass on the measured climb performance:
• Mean-all-up-mass method;
• Constant mean altitude and power/weight ratio method.
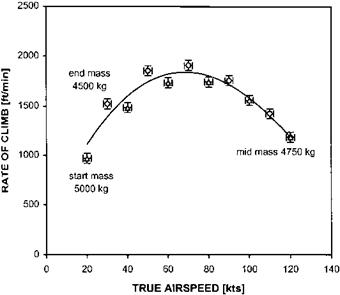
The mean-all-up-mass method involves documenting the rate of climb through the same altitude band (typically 1000 ft) with the test airspeeds being flown in a particular order. Starting with the lowest, the test airspeeds are progressively increased up to the maximum then progressively reducing intermediate speeds are evaluated back down to the minimum, see Fig. 3.30. A mean line drawn between two curves, corresponding to the test points from minimum to maximum and vice-versa represents the climb performance for a mass equal to the average for a complete run.
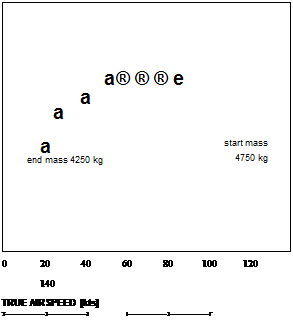
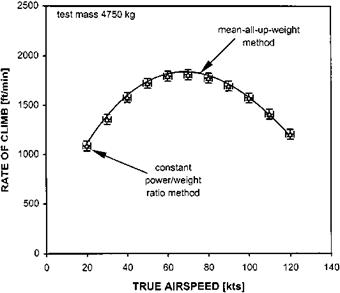
The constant power/weight ratio method is slightly different. Although the altitude band remains the same, as with the previous method, the power (or torque) is reduced progressively as fuel is burnt to maintain the power/weight ratio constant. The test speed is changed progressively from minimum to maximum or vice-versa, see Fig. 3.31. Figure 3.32 compares the results obtained using both methods. Note the similarity in the curve fit obtained.
As in other tests that involve measurement of the vertical speed, it is common practice to determine the rate of climb by documenting incremental altitude and
|
 2500
2500
2000
c
Ё
i. 1500
CD
s
Z]
о
0 1000
ш
1
500
![]()
Fig. 3.31 Climb performance – constant power/weight ratio method.
elapsed time. Charts of altitude versus time are plotted for each speed tested and used to obtain a smoothed rate of climb by means of a straight-line fit. This process compensates for data scatter and highlights any non-linearities associated with the helicopter drifting away from trim. An analogous process can also be used to determine
|
Fig. 3.32 Climb performance – comparison of methods. |
the rate of descent in a flight idle glide or an autorotation. Data may be gathered economically if climbs and descents are combined using a sawtooth flight profile.
Consolidated plots can be compiled once data has been gathered for a range of conditions. Typically data is presented for a range of altitudes at the same all-up-mass or for a range of all-up-masses at the same altitude, see Figs 3.33 and 3.34 which show typical variations of climb performance with mass and altitude. These consolidated plots are then used to draw-up climb schedules for assessment during ceiling climb tests.


