SAMPLE SOLUTIONS WITH PANEL CODES
Panel methods have the advantage of modeling the flow over complex three-dimensional configurations. However, the first thing to remember is that the method is based on potential flow solutions and therefore its “forte” is in solving attached flow fields. In the case of such attached flow fields the calculated pressure distribution and the lift will be close to the experimental results but for the drag force only the lift-induced drag portion is provided by the potential flow solution and an estimation of the viscous drag is required. For flows with considerable areas of flow separations the method usually can point toward areas of large pressure gradients that cause the flow separations but the computed pressure distributions will be wrong. The following examples will show some of the cases where such methods can provide useful engineering information, along with some cases where the effects of viscosity become more important.
Example 1 Wing-body combination. All classical methods (e. g., lifting surface)
were capable of modeling simple lifting surfaces only with some estimation of
|
|
|
|
|
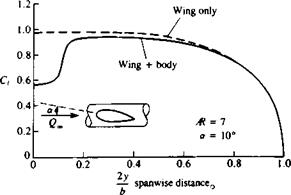
FIGURE 12.27 Effect of fuselage on the spanwise loading of a rectangular wing. |
wing—fuselage juncture effects. Panel methods, on the other hand, can solve the flow over fairly complex wing-fuselage combinations. For example, Fig. 12.27 shows a typical case where the lift near the centerline is reduced due to the presence of the fuselage. The wake vortex originating near the wing-fuselage juncture, whose circulation is opposite in direction to the tip vortex, must be modeled carefully (so that it will not intersect the fuselage). The location of this vortex is important, too, since it may affect the flow on the rest of the aircraft and may cause flow separations on the aft-section of the fuselage and on the tail.
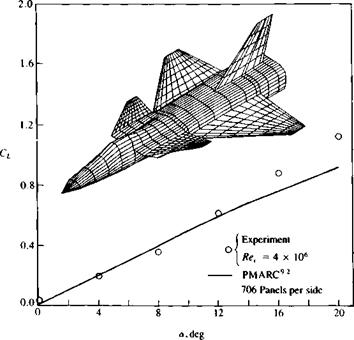
Example 2 Lift of high-speed airplane configuration. Airplanes that operate at higher speeds where compressibility effects are not negligible usually encounter low-speed flight conditions during takeoff and landing. For these conditions panel methods can provide useful aerodynamic information. As an example, the calculated and experimental lift coefficients for two such aircraft configurations are provided in Figs. 12.28 and 12.29. Both figures indicate that at the lower angles of attack (less than 15°) the calculations agree fairly well with the experiments. However, at larger angles of attack, leading-edge vortex lift (e. g., for a> 15° in Fig. 12.28 and for 15° < a <30° in Fig. 12.29) can cause additional
|
FIGURE 12.28 Comparison between calculated and experimental lift coefficients for a generic fighter aircraft configuration. (Experimental data from Stoll, F., and Koenig, D. G., “Large Scale Wind-Tunnel Investigation of a Close-Coupled Canard-Delta-Wing Fighter Model through High Angles of Attack,” AIAA paper 83-2554). |
FIGURE 12.29
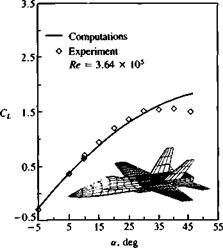 Comparison between calculated and measured lift coefficients for the McDonnell Douglas F/A-18 airplane (using 668 panels per side). From Ref. 12.16. Reprinted with permission. Copyright AIAA.
lift and such vortex lift models were not introduced in this chapter. Also, the flow over these complete configurations is usually very complex and many regional flow separations and vortex flows exist. Therefore, even if the results presented in these two figures agree reasonably with the computations, the computations can serve mainly as a first-order prediction tool and for final validation usually extensive testing is required.
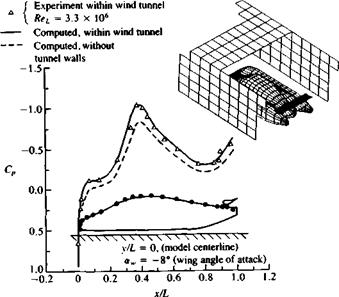
Example 3 Wind tunnel wall interference corrections. Wind tunnels provide a well-controlled environment where a variety of tests, such as measurement of aerodynamic pressures and loads, can be carried out. However, model designers usually prefer larger models and therefore, in many cases the effect of the test section walls is not neglibible. The most obvious interference between the model and the wind tunnel test section walls is called “solid blockage,” where the presence of the model inside the wind tunnel reduces the flow cross-sectional area and according to Bernoulli’s principle the flow speed will increase there. Since the local velocity at the test section is higher than it would be in a free flow outside the wind tunnel the aerodynamic coefficients are overestimated. In addition to this “blockage effect” there is a “reflection effect” that changes the lift of lifting surfaces near solid boundaries (as in the case of ground effect). Figure 12.30 shows the increase in the suction peaks (and velocity) over the upper surface of a streamlined automobile model that was well predicted by the panel method. In this case, for theoretical purposes the aft-section of the vehicle was highly streamlined and flow separations there were minimal, but a generalization of this approach to other bluff body shapes must be approached with extra care.
In general, the wind tunnel wall corrections are obtained by two sequential computations where in the first the flow field over the model within the wind tunnel test section is computed and in the second computation the wind tunnel walls are removed. The differences between these two cases provides the
|
FIGURE 12.30 Effect of wind tunnel walls on the pressure distribution on the upper surface centerline (shown by the black dots) of a streamlined automobile (model frontal area to wind tunnel cross-sectional area ratio was about 13 percent). From Ref. 12.17. |
potential flow effect of wind tunnel boundaries on model lift and blockage (Refs. 12.16 and 12.17). Also, note that this wind tunnel wall correction method inherently includes effects of lift and blockage, and provides more details than previous semi-empirical methods (for the complete wind tunnel wall effects, though, the viscous effects should be included, too).
Example 4 High-lift, low-aspect ratio multielement wing. As the wing aspect ratio becomes small, two-dimensional airfoil analysis may not be applicable and a considerable difference exists between the two – and three-dimensional chordwise pressure distributions. Consequently, a two-dimensional development of such an airfoil section, without considering the complete three-dimensional analysis, is not recommended.1218 As an example, typical computational results for the two-dimensional pressure distribution on a four element airfoil are shown in Fig. 12.31a. The computed pressure distribution, at the centerline of a rectangular wing (Ж=1.5), having the same airfoil section and the same attitude, are presented in Fig. 12.31b. The most obvious difference between the two cases of Fig. 12.31 is the threefold reduction in the Cp range of the three-dimensional data and the change in the shape of the pressure distribution when compared with the two-dimensional case. Also, in the three-dimensional case, pressure gradients are the strongest near the second flap (from the trailing edge) and, with increased
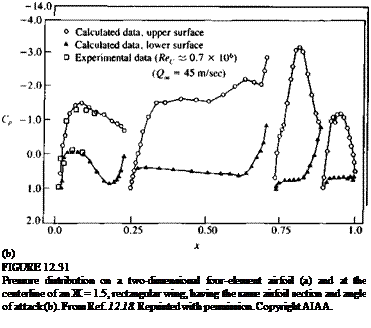 |
angle of attack, flow separation can be initiated here (and not near the leading edge, as it seems from the two-dimensional data).
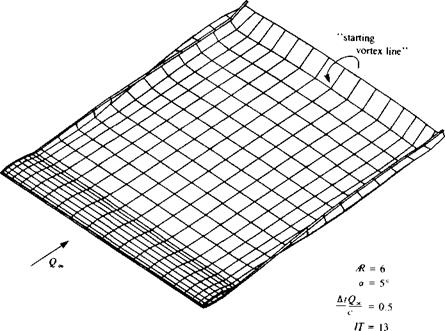
Example 5 Wake length. One of the objectives of this section is to highlight some possible errors in modeling the potential flow problems. One such frequent problem arises when the wake of a wing is too short (in steady-state flow). This problem occurs when, due to the need to present the wing and the wake in the
|
FIGURE 12.32 Location of the starting vortex in the case of specifying a short wake for an Ж = 6 rectangular wing in a steady-state flow. |
same scale, the wake model becomes short. Since in most situations the wake is modeled by constant-strength doublet elements a starting vortex is present at the edge of the far field panel as shown in Fig. 12.32. This vortex induces a downwash on the wing that reduces its lift. The problem can easily be cured by a longer wake, which should be at least 20 chordlengths behind the wing trailing edge (of course this distance depends on wing aspect ratio; see also the effect of a starting vortex in Example 1, Section 13.12).
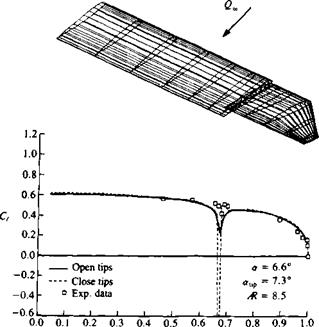
Example 6 Modeling of gap in wing. Example 4 indicated that the modeling of a gap between two airfoils is obtained in a satisfactory manner. However if the gap is parallel to the streamlines, as in the case of the chordwise gap between a main wing and a flap, establishing a good panel model may be difficult. Since the potential flow does not account for viscosity, the velocity inside a narrow gap will increase to unrealistic values, which in reality are reduced by the viscous friction. This problem is demonstrated by Fig. 12.33 (taken from Ref. 12.19) where such a side gap between a large aspect ratio wing and a moving wing tip (shown in Fig. 12.33) is calculated by different panel models. When the two wing parts were modeled as two separate, closed bodies, the high speed within the gap resulted in large suction peaks (shown by the broken line) that are different from the experimental data. The solid line shows the case where the wing and the wing tip closures were removed from the gap (thereby leaving the two bodies open in the
|
FIGURE 1233 Effect of a gap between a floating wing tip and the wing on the spanwise loading. From Ref. 12.19. |
gap region) and the results now agree more with the experimental data. Since this example was executed with a first-order panel method (Ref. 12.11) that is not sensitive to gaps in the panel model this problem was partially resolved, but this approach is not applicable to higher-order panel methods. (Note that the accurate potential solution is practically inaccurate in this case and the removal of the wing side edge closures inside the gap should be viewed as a viscous flow effect modeling exercise!)


