Vertical climb testing
For vertical climb performance testing, V = 0 and Z is not fixed, so for climbs outside of ground effect the general power required relationship can be reduced to:
p = J W V _m.
am3 m ’ VO/
which can be rearranged more sensibly as:
Y = f, W,^)
m affl3 am V9J
Vertical climb testing is achieved by establishing the aircraft in an OGE hover, at a altitude about 500 ft below that corresponding to the selected value of Wlam2 and with the rotor speed set for the desired m lV9. Power is increased incrementally up to the maximum available and the vertical rate of climb generated at each increment is measured. The climb begins below the required test altitude so that data can be logged at the required Wlam2. As fuel is used, the target altitude is increased to maintain Wlam2 constant. Ideally a ‘smoothed’ rate of climb is obtained from altitudeltime data recorded at 100 ft intervals during the climb. This so-called reduced power vertical
|
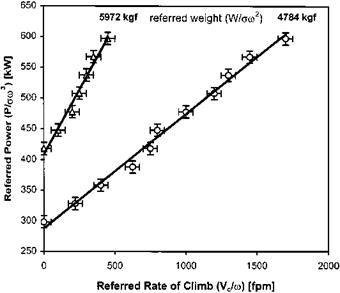
Fig. 3.21 Referred vertical climb test data – RPV method. |
(RPV) technique can be replaced by a quicker, but less accurate, alternative based on data obtained at maximum torque only (the maximum power vertical – MPV method).
The smoothed rate of climb is used to plot P/am3, or Q/am2, against Vc/m, as shown in Fig. 3.21, for a range of constant values of W/am2. Ideally these tests should all be performed at the same value of m/^9 to eliminate the possibility of tip effects affecting the data. This will typically require the flight crew to adjust the rotor speed as the climb is commenced to account for static droop and the reduction of temperature with altitude. Ease of test planning (selection of convenient hover altitudes) and test conduct (use of the MPV method) will generally lead to the collection of vertical climb data at a range of referred weights over which there has been imprecise control, see Fig. 3.22. Since mission weights may not have been targeted, it is necessary to develop a more usable form for this data. For selected values of Vc /m a chart such as Fig. 3.23 can be produced showing corresponding values of P/amз at various values of W/am2.


