VERTICAL PERFORMANCE TESTING
From a practical viewpoint the difficulty with vertical performance testing is that of establishing and holding a steady zero-airspeed flight condition in which accurate measurements can be made. In order to establish such a condition in free flight it is necessary to use some means other than the ASI to indicate a true hover or to rely on a fixed, ground reference. The latter method is simplest but means that the tests must be carried out relatively close to the ground in as near still air conditions as possible (wind speeds less than 3 kts). Ballast or cable tension may be required to obtain a sufficient spread of hover weights.
The climb performance of a helicopter can be divided into two separate areas: vertical performance and forward flight climb and descent performance. The latter is used to determine the best rate of climb, optimum climb schedule and service ceiling. The former, together with hover performance data, is used to give the pilot the fullest possible information on the aircraft’s limits in axial flight by showing how vertical rate of climb varies with altitude, OAT, weight, wind speed and RRPM at a specified engine rating. The techniques employed here are reduced power verticals, maximum power verticals or low airspeed verticals. The likelihood that the conditions will be such that the tests can be carried out in still air is remote so it is normal practice to either climb vertically relative to the ground in low windspeed conditions and correct the results to zero windspeed or to climb vertically from a free-air hover.
3.5.1 Free flight hover testing
As derived above, the general power required relationships are:
p = Jw v V Z or _p_ = Jw V V Z _®_
sV9 Is’m’m’ ’^0/ ora3 lam2’ m’m’ ’^01
|
|||||||||||||||||||||||||||||||||||||||||||||||||||||||||||||||||||||||||||||||||||||||||||||||||||||||||||||||||||||
|
Rotor speed (%) |
ISA – 20°C |
ISA |
ISA + 15°C |
|||
|
sea level |
10 000 ft |
sea level |
10000 ft |
sea level |
10 000 ft |
|
|
95 |
0.992 |
1.023 |
0.957 |
0.984 |
0.932 |
0.958 |
|
100 |
1.044 |
1.077 |
1.007 |
1.036 |
0.981 |
1.008 |
|
105 |
1.097 |
1.131 |
1.057 |
1.088 |
1.030 |
1.059 |
|
Table 3.5 Variation of referred rotor speed (%) available at test site. |
|
Atmosphere |

![]()
![]()
|
Table 3.6 Test conditions required to match original target referred parameters. |
|||
|
Target Wlam2 |
7 000 |
7 000 |
7000 |
|
Target mlVe |
1.00 |
1.04 |
1.08 |
|
Wl5 |
7 000 |
7 571 |
8165 |
|
Start AUM (kg) |
4 900 |
4 900 |
4900 |
|
Test altitude (ft) |
9 543 |
11 556 |
13 465 |
|
Expected OAT (°C) |
-3.9 |
-7.9 |
-11.7 |
|
Test RRPM (%) |
96.7 |
99.8 |
102.9 |
|
End AUM (kg) |
4 450 |
4 450 |
4450 |
|
Test altitude (ft) |
12011 |
13 987 |
15 862 |
|
Expected OAT (°C) |
-8.8 |
-12.7 |
-16.4 |
|
Test RRPM (%) |
95.8 |
98.9 |
101.9 |
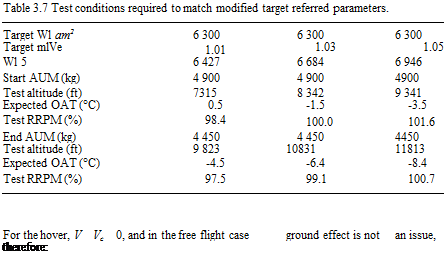
Rotor speed effects are evaluated by obtaining data at the same referred weight but over a range of mQ0. If the variation in ground effect with height is required, separate curves can be obtained for each value of hover height, Z, usually defined as the wheel
|
Target W/am2 |
4 400 |
5 500 |
6 600 |
|
Target m/V9 |
1.03 |
1.03 |
1.03 |
|
W/8 |
4 668 |
5 835 |
7002 |
|
Start AUM (kg) |
4 200 |
4 900 |
4900 |
|
Test altitude (ft) |
2 894 |
4 753 |
9 550 |
|
Expected OAT (°С) |
9.3 |
5.6 |
-3.9 |
|
Test RRPM (%) |
102.0 |
101.3 |
99.6 |
|
End AUM (kg) |
3 750 |
4 450 |
4450 |
|
Test altitude (ft) |
5 935 |
7 308 |
12018 |
|
Expected OAT (°C) |
3.2 |
0.5 |
-8.8 |
|
Test RRPM (%) |
100.9 |
100.4 |
98.7 |
|
Table 3.8 Test conditions required to match additional referred parameters. |
or skid clearance above ground. If detailed results are not necessary it is usually sufficient to obtain results IGE and/or OGE. If hover height is not considered and m/V9 effects are insignificant then the results will be presented as a single curve of P/am2 against W/am2. This method of presentation is used regardless of the type of helicopter since rotor RPM changes should affect both parameters in the same proportion and a single curve should result. Had P/8^9 versus W/8 been used then, even with negligible tip effects, separate curves would still result for each m/^9 (see the discussion on tip effects given below).
At each of several values of m/^9, torque and rotor speed are measured at sufficient values of weight to cover the desired range of Wlam2. At each test point OAT, pressure altitude and engine data should also be recorded. Prior planning is required to ensure that the desired range of referred weights will be achieved. Simple theory predicts that if rotor RPM effects can be ignored, that is the profile drag coefficient is constant, then:
where K1 and K2 are constants.
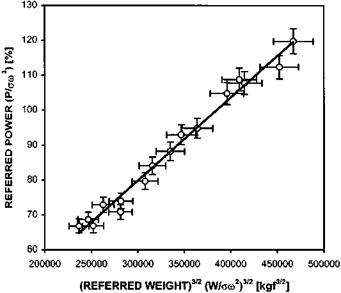
If therefore P/am3 is plotted against (W/am2)3/2 the result will be a straight line provided K2 actually remains constant. Thus, in the absence of tip effects, the results obtained from the free-air hovering tests can be smoothed by the following method:
• Plot P/am3 against (W/am2)3/2.
• Draw the best straight line through the points.
• For desired values of W/am2, calculate (W/am2)2/2 and use the smoothed line to read off corresponding values of P/am2.
• Plot P/amз against W/am2.
In Fig. 3.15 a typical set of test data is presented. A straight line fit has been applied along with error bars based on a 3% tolerance. Assuming that this is the accepted level of accuracy for the test it can be seen that the trend line falls within the error bars. Thus a single straight line fit is appropriate and RRPM effects can be ignored. This fit has been used to transfer the trend information to Fig. 3.16. (Note that the line presented in Fig. 3.16 is not straight since the independent variable is now W/am2.)
|
Fig. 3.15 Typical hover performance test data. |
|
Fig. 3.16 Smoothed hover performance data. |
3.5.2 Tethered hover testing
The same referred groups are used for tethered hovering tests as for free-air hover trials. In this case, however, hover height is an important parameter. The variation of
|
Fig. 3.17 Typical tethered hover data. |
ground effect with hover height can be measured accurately using tethering cables of different lengths. The relationship used is either:
p _ Jwz _m _p__ J_w_
5Ve V S ’ ’ 70/ or am* ’ ’ 70/
As discussed above the latter equation is most often used. The helicopter is established in a tethered hover with the cable taut and power is increased until the maximum permitted tension is achieved. Having taken all the relevant data, power is reduced in stages (data being recorded at each stage) until cable tension is almost lost. The cable tension simulates varying aircraft weights. Hover height is controlled by the cable length; various cable lengths providing a good range of heights is desirable. Results are usually presented as a carpet plot of Plam* against Wlam2 and Z. The ‘smoothing’ process described for free air hovering tests may be used for tethered hovering trials. Figure 3.17 illustrates the form in which the results finally appear. It is important to remember that tethered hovering trials must be carried out in as near still air conditions as possible, less than 3 kts is usually taken as acceptable [3.7].


