Our heavyweight helicopter equal in the world does not have
In Rostov started production of the most load-lifting rotary-wing car The Russian holding «Helicopt[...]

Everything about aircrafts and helicopters. News and events in aviation worldwide. Civil, transportation, military helicopters and airplanes.

Everything about aircrafts and helicopters. News and events in aviation worldwide. Civil, transportation, military helicopters and airplanes.

Everything about aircrafts and helicopters. News and events in aviation worldwide. Civil, transportation, military helicopters and airplanes.

Everything about aircrafts and helicopters. News and events in aviation worldwide. Civil, transportation, military helicopters and airplanes.


The real operating conditions for MAVs are quite different from the conventionally low-turbulence wind – and water-tunnel setup. In real flight, MAVs often operate in gusty environments. Obremski and Fejer [152] studied the effect of unsteady flow on transition. They experimented with a flat plate subject to a free-stream velocity varying sinusoidally with a mean:
 |
U = Uref[1 + Na sin(2n ft)], (2-21)
in space and time by a disturbance wave packet. By applying a quasi-steady stability model, they concluded that in the high Rens range the wave packet is amplified rapidly and bursts into turbulence, whereas in the low range the wave packet bursts into turbulence at a much higher Reynolds number. Guided by their study, Lian and Shyy [117] investigated the influence of free-stream oscillations on the transition for separated flows. In their first test, they set Na = 0.33 and ы = 0.3, resulting in a Strouhal number of 0.0318 and a Rens of
|
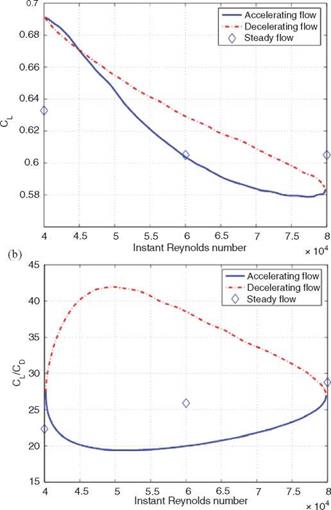
Figure 2.33. Aerodynamic coefficient of an SD7003 airfoil in a gusty environment during one cycle for non-steady Reynolds number, Rens = 9.9 x 10⁴, showing the hysteresis phenomenon: (a) lift coefficient; (b) lift-to-drag ratio [117]. |
9.9 x 10⁴. They kept the frequency ы well below the range of the expected unstable TS wave frequency, which is around 10 Hz.
Figure 2.33 shows the lift coefficient and lift-to-drag ratio during one selected cycle. Clearly, under a gust situation, the aerodynamic parameters display the hysteresis. For example, when flow accelerates (the Reynolds number increases from 6 x 10⁴ to 8 x 10⁴), the lift coefficient does not immediately reach its corresponding steady-state value. Instead, the steady-state value is reached in the decelerating stage. Compared with a steady incoming flow, the gust leads to a higher lift coefficient at the low-velocity end and a lower lift coefficient at the high-velocity end. The lift-to-drag ratio variation during one cycle is substantial. For example, at the Reynolds number of 6 x 10⁴, the lift-to-drag ratio with a steady-state free-stream is
|
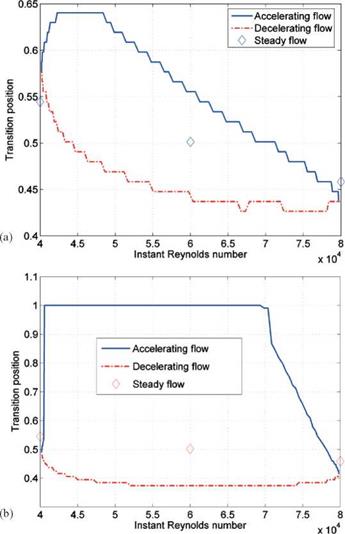
Figure 2.34. Transition position on an SD7003 airfoil during one cycle of the gust at (a) the non-steady Reynolds number, Rens = 9.9 x 10⁴; (b) the non-steady Reynolds number, Rens = 1.98 x 10⁴ [117]. |
around 26; for gust flow, the instantaneous lift-to-drag ratio reduces to 20 when the flow accelerates, but elevates to 38 when the flow decelerates.
Along with the variations in lift and drag, the transition position is also affected by the gust. As shown in Figure 2.34 the transition position moves toward the leading edge when the flow is accelerating, and it moves toward the trailing edge when flow is decelerating. During the accelerating stage, the instantaneous Reynolds number is increasing. As the Reynolds number increases, the flow experiences an early transition. In the simulation of Lian and Shyy [117], the transition point is simply linked to the computational grid point without further smoothing, resulting in a stair-stepped plot in Figure 2.34.
Lian and Shyy [117] also investigated a higher frequency of f = 0.24, five times higher than the previous case, resulting in a Rens of 1.98 x 10⁴, which is lower than the
critical value. Their numerical result shows that the transition position varies with the instantaneous Reynolds number (see Fig. 2.34). This result seemingly contradicts the observation of Obremski and Morkovin [153]. However, it should be noted that Obremski and Morkovin [153] drew their conclusion based on experimentation over a flat plate at a high Reynolds number (106), in which the flow is the Blasius type and experiences natural transition. In the test of Lian and Shyy [117], in contrast, the separated flow amplifies the unstable TS wave at such a great rate that it results in a faster transition to turbulence, typical of the bypass-transition process.
Comparison of the transition position at two different non-steady Reynolds numbers reveals that the flow experiences transition for the entire oscillation cycle at a higher non-steady Reynolds number, whereas at the lower value the flow becomes laminar at the early accelerating state and remains laminar until the instant Reynolds number reaches around 7 x 10⁴. It is possible that during the decelerating stage the transition position moves toward the trailing edge because of the lowered Reynolds number. At a higher non-steady Reynolds number (i. e., at a lower frequency), the deceleration has less impact on the transition and the LSB can sustain itself; at a lower non-steady Reynolds number (i. e., at a higher frequency), the deceleration has more impact on the transition and the LSB cannot adjust itself with the high rate of change needed to maintain the closed bubble and the LSB bursts. A closed LSB forms only when the Reynolds number reaches 7 x 10⁴. To better appreciate this phenomenon, see the phase and shape factor during one cycle plotted in Figure 2.35.
Another interesting observation at Ren = 1.98 x 10⁴ is the drag coefficient shown in Figure 2.36. During the decelerating stage the gusty flow produces thrust. Analysis shows that the thrust is due to the friction force.