GHAME3: Hypersonic Vehicle Simulation
Thanks to NASA’s forethought, we have a complete data package of a hypersonic vehicle, called Generic Hypersonic Aerodynamic Model Example (GHAME). You will encounter it again in Chapter 10 as an example of a complex six-DoF simulation.
The simple three-DoF structure of the CADAC GHAME3 simulation is shown in Fig. 8.8. The three external force modules, gravity (G2), aerodynamics (Al), and propulsion (A2) are combined in the A3 Force Module to serve Newton’s law (Dl). In addition, the Geophysics Module G2 provides also atmospheric density pressure and sonic speed.
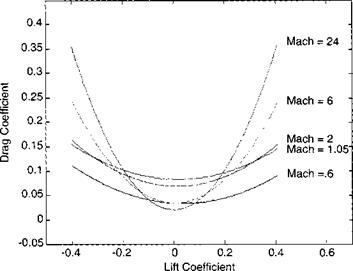
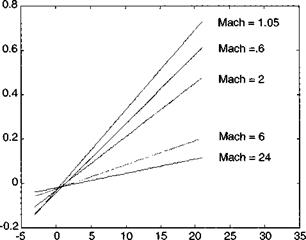
8.3.1.1 Aerodynamics. For the purpose of this chapter, I have reduced the aerodynamics of the six-DoF GHAME model to an offset parabolic drag polar by curve fitting the full data set (see Fig. 8.9). Because the lift coefficient CL is the independent variable, automatic plotting programs place it on the abscissa and use the drag coefficient as ordinate. Notice the change of the drag polar with Mach number. The minimum zero-lift drag Cd0 occurs at subsonic and hypersonic speeds and peaks near Mach 1. The lift-over-drag ratio, indicated by the flatness of the parabola, decreases with increasing Mach number. Do you see the slight bias of the parabola centerlines toward positive lift values? This shift is more evident in the lift slopes of Fig. 8.10. The zero-lift points occur between 1-2 deg angle of attack at all Mach numbers. Both sets of curves are implemented as tables in the Al Module.
8.3.1.2 Propulsion. The combined-cycle engine of GHAME is programmed in Module A2. From Eq. (8.26)
|
|
|
|
|
|
we calculate thrust F from two tables, specific impulse /sp(A/, thr) and capture – area coefficient Ca(M, a). To keep track of the remaining fuel, the fuel rate is monitored based on Eq. (8.24)
![]() F x thr m =
F x thr m =
Isp8o
and integrated to provide the expended fuel mass.
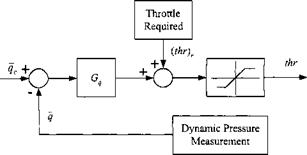
One of the crucial factors of a hypersonic vehicle is the optimum throttle setting for best climb at minimum heating. An ascent with constant dynamic pressure approximates these requirements. Thus, we incorporate an automatic throttle feedback loop into the propulsion module that maintains constant dynamic pressure and call it autothrottle. Figure 8.11 shows the control loop. Measured dynamic pressure q is compared with the desired input qc, processed through a gain Gg, and summed with the required throttle setting (thr)r overcoming the drag force. After limiting, the throttle setting for the thrust of the engine is obtained.
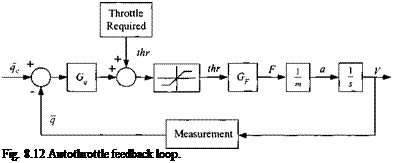 |
To synthesize the autothrottle gain Gq, we complete the control loop as shown in Fig. 8.12. The thrust F from the engine with throttle setting thr accelerates the vehicle and, after integration, provides the velocity V that determines the dynamic pressure q.
Several steps determine the gain Gq. First, calculate the required thrust Fr by setting it equal to the drag, projected into the body Is axis by the angle of attack a
![]() CDS _
CDS _
—— 4c
cos a
With Eq. (8.27) we calculate the required throttle setting
![]() Fr
Fr
0.029 IspgoPVCaAc
The thrust gain is therefore
The autothrottle control loop is essentially a first-order lag transfer function
![]() 1
1
T„s + 1
with the autothrottle time constant
To determine the autothrottle gain, pick a reasonable time lag between the commanded and achieved dynamic pressure and calculate the gain from
![]() 2m 1 PVGf Tq
2m 1 PVGf Tq
where m is the mass of the vehicle. Clearly, the control loop is always stable, just make sure to select a realistic time constant, possibly making the time constant dependent on air density.
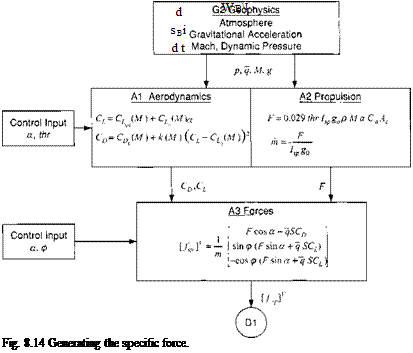
8.3.1.3 Forces. The aerodynamic and propulsive forces are combined in Module A3, coordinated first in load factor and then in velocity axes, divided by vehicle mass, and sent to the D1 Module as specific force [/sp]v.
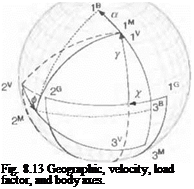
Refer back to Fig. 8.7 to visualize the geometry. To get a better understanding of the angles and coordinate axes, Fig. 8.13 displays all of the relevant information. It shows the heading and flight-path angles x and y, the bank angle ф, and the angle of attack a. These angles reflect the transformation sequence
jg (a jM jv У’* jG
Now we combine it with the thrust force F from Eq. (8.26):
![]()
 |
F cos a — qSCD 0
—Esin o; — qSCi
 |
||
and transform it to velocity coordinates
Given о; and ф as input, the so-called contact forces (nongravitational forces) can be evaluated and provided as specific force /sp to Newton’s equation in velocity coordinates
[/spr = – Ua, p]V
m
where m is the vehicle mass.
8.3.1.4 Specific force. We have arrived at a convenient situation to summarize the four Modules G2, Al, A2, and A3 (see Fig. 8.14). Given the aerodynamic and propulsive characteristics, the inputs а, ф, and thr produce the specific force that is sent to the D1 Module.
8.3.1.5 Newton’s law. For the equations of motion, let us go back to Eq. (8.4) and divide both sides by the vehicle mass m
 |
and adjoin the position equations (8.5):
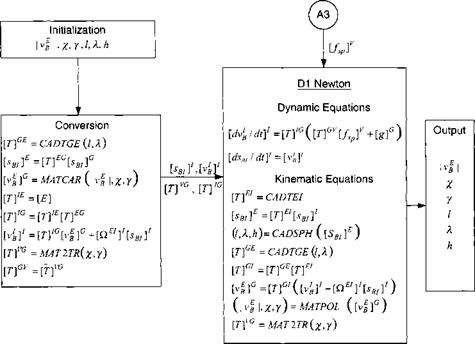
As convenient these equations are for integration, their interpretation is as difficult. Who wants to input trajectory parameters in inertial coordinates? We would much rather use geographic variables as input and output. Therefore, we need to develop code that transforms the input variables’ geographic speed |uf |, heading angle y„, flight-path angle у, longitude l, latitude X, and altitude h into inertial position [sbi]1 and velocity [r: д J7. Figure 8.15 shows the equations of motion and the conversion process.
Two types of utility subroutines are employed: the matrix utilities MATxxx and CADAC utilities CADxxx. You can find the MATxxx routines described in the C ADAC user documentation. These subroutines abide by FORTRAN call conventions. Writing them as [uf]G = MATCAR(Vg I, x. y) emphasizes the input/output relationship, but they are coded actually as CALL MATCAR ([u|]G, |uf |, x, y). There are three CADxxx subroutines appended to the D1 Module. CADTEI produces [T]EI, CADTGE calculates the transformation matrix Eq. (3.13), and
|
Fig. 8.15 Calculating the trajectory parameters. |
CADSPH is the inverse transaction. If you are wondering how to get [sB/]G, remember that its third coordinate is just the distance to the center of the Earth [Wif = Іo 0-(R9 + h)l
Now it is your turn to make this hypersonic vehicle soar into the stratosphere. Review the MODULE. FOR code, the INPUT. ASC and HEAD. ASC files; compile, link, and run the test case. It should produce an output that looks like the traces in Figs. 8.16 and 8.17.1 produced both figures with the CAD AC Studio plot programs KPLOT/2DIM and KPLOT/GLOBE. As you see from the weaving trajectory, cruising at constant angle of attack does not deliver a constant altitude trajectory.
Now change the input parameters and observe a variety of trajectories. Get a feel for the sensitivity of the vehicle to various modifications. Afterward do the SSTO project or turn to the ROCKET3 simulation.


