Using the Computer Program
The equations derived in the previous sections an be used to set up a program to compute nondimensional, isolated rotor performance or the performance and trim conditions for an entire helicopter. An isolated rotor program was used to produce the charts at the end of this chapter. It used А/, 0O, 01} fi, and Ml 90 (advancing tip Mach number) as inputs. The first estimates of Ct/g and of the cyclic pitch required to trim the pitching and rolling moments to zero were made using the
|
|
|
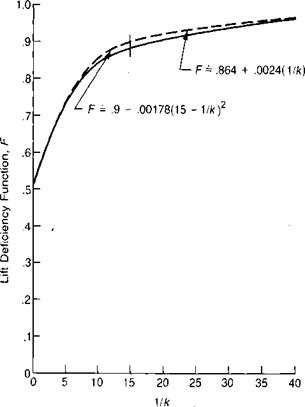
FIGURE 3.59 Unsteady Aerodynamic Lift Deficiency and Lag Functions |
Source: Theodorsen, “General Theory of Aerodynamic Instability and the Mechanism of Flutter," NACA TR 496, 1935.
closed-form equations. The program was then cycled and the thrust and moment coefficients calculated. If the moment coefficients were outside a predetermined tolerance, the cyclic pitch was modified and another iteration was performed. The actual tolerances used were ±0.0005 on C^/a and ±0.0020 on CJg. These tolerances correspond to approximately ±0.1 degree for B1 and ±0.5 degree for Av which are sufficient to ensure engineering accuracy of the calculations. The equations for the corrections of cyclic pitch that gave satisfactory convergence in most flight conditions were:
Л#! = —190 (1 — p) CR/a deg
|
Static Lift Curve Measured Oscillatory Lift Curve
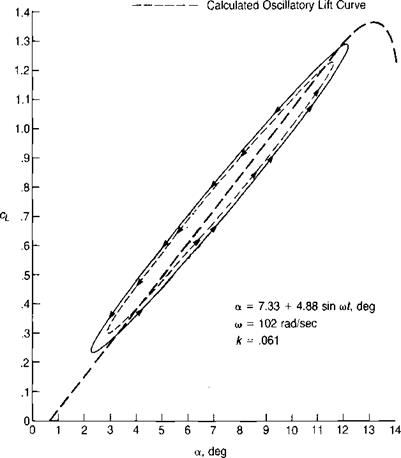
FIGURE 3.60 Correlation of Theory and Test Results for an Oscillating Airfoil |
Source: Liiva, Davenport, Gray, & Walton, “Two-Dimensional Tests of Airfoils Oscillating Near Stall,” USAAVLABS TR 68-13, 1968.
A A, = -60 (2 + |i2) CJo deg
Once the cyclic pitch that satisfied the moment coefficient criteria was established, the program evaluated the thrust, torque, and H-force coefficients.
The ability of the isolated rotor to overcome parasite drag if it were actually installed on a helicopter is given by the equilibrium equation:
fy Totj-j-p H
This can be nondimensionalized into a primary parameter, which appears on the rotor charts:
|
/M + (Ct/c)24 = 1* |
It is sometimes useful to have an indication of how close the rotor is operating to its capability. One such indicator is the angle of attack of the retreating tip:
<4270 = 0o + O i + B, + tan 1 —
і H
Another indicator that has been used is the maximum value of profile torque coefficient calculated at any azimuth position on the rotor:
 |
ACQ/o0= f ^-q° dr/R Jo dr/R
where
dCg/a0___ Ub p £
dr/R “TT f°
This parameter is computed at each azimuth during the integration for torque, and the computer can be made to remember the highest value obtained and to print it and its azimuth as part of the output.
For an analysis of a complete helicopter, the physical parameters of the main and tail rotors and the lift and drag characteristics of the airframe are used as inputs along with the gross weight, the forward speed, the atmospheric density, and the speed of sound. The program is made to iterate on 0O, А/, and 0Ot, as well as on Ax and Bx, to find the final trim conditions in a process identical to that used with the closed-form equations.
![]()
The charts at the end of this chapter have been produced with the methods just described and may be used to solve all of the common forward flight performance problems involving either main or tail rotors. The charts are based on a series of arbitrarily selected rotor parameters, although—as will be discussed—they are flexible enough to be used for rotors with different parameters.
The first chart of each pair can be used to obtain the power required in forward flight at a given tip speed ratio for known values of f/Ab, o, and CT/o. With these values defined, the top chart gives the collective pitch and the bottom chart the corresponding value of Cq/o. Two types of stall limits are shown on this chart: the angle of attack of the retreating tip, ali270, and the maximum value of the profile torque at any azimuth station, ACq/gq. Reference 3.46 uses values of 0.004 and 0.008 for ACq/gq as "lower and upper stall limits,” respectively, to indicate the region where many rotors begin to get into trouble because of stall effects. Most rotors can operate up to the higher set of limits as a helicopter rotor and well beyond it in the autogiro mode. The second set of charts can be used to obtain trim values of Q/o, А/, Ax — bXs, and Bx + aXj.
The charts have been constructed using the following rotor parameters:
Twist: —5°, linear
Airfoil: NACA 0012
Advancing tip Mach no: .7 (i. e., below the speed for compressibility losses)
Blade chord/radius ratio: 0.079
Tip loss factor: .97
None of these assumed parameters imposes significant limits on the use of the charts for rotors with different parameters. For rotors with twist other than
—5°, the charts may be used by referencing the collective pitch to the pitch at the 75% radius. The collective pitch to use with the charts is:
Ч_,.-0. + -7М0. + 5’)
For operation away from retreating blade stall, this is the only correction advised. For operation in the stall regime, twist affects the location of the limit lines of ACq/c0 and a1>270 on the torque plot. These limits move to higher values of CT/o for more than —5° of twist and to lower values for less twist. The displacement of the limit lines for other than —5° is approximately:
ACT/o = -0.003(0! + 5°)
The same displacement applies to the points on the torque curves where sudden changes in curvature occur because of retreating tip stall.
Many modern rotors have airfoils with higher stalling angles than the NACA 0012 on which the charts were based. These airfoils will also shift the limit lines and the points of sudden curvature change to the right. The magnitude of the shift can be estimated by the increase in the airfoil stall angle and by the distance between the two limit lines for (X1270 = 12° and (X1270= 16°.
Operation of the rotor at advancing tip Mach numbers that cause drag divergence can be accounted for using the method of Figure 3.43. This allows a correction to be made to the torque coefficient based on the amount the three- dimensional drag rise Mach number of the tip airfoil is exceeded. Thus the method can be used with airfoils other than the NACA 0012 if the airfoil drag characteristics are known.
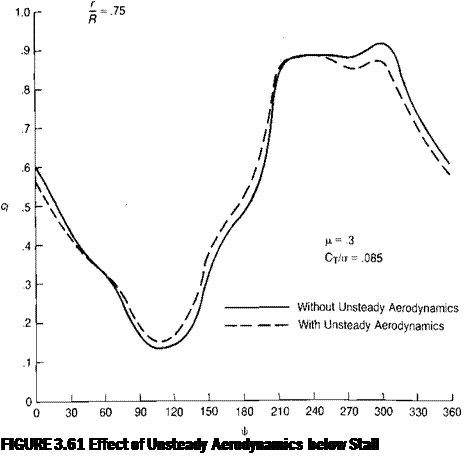
The chord/radius ratio, c/R, enters into the analysis of unsteady aerodynamic effects both above and below stall. For the charts, a ratio of 0.079 was used. It will be assumed that these effects are small enough that the charts can safely be used for blades with other aspect ratios. Similarly, the tip loss factor of 0.97—which is a guess at any rate—can be assumed to apply to any reasonable rotor.
To illustrate the various uses of the charts, a series of numerical examples is given in Table 3.5.


