
Our heavyweight helicopter equal in the world does not have
In Rostov started production of the most load-lifting rotary-wing car The Russian holding «Helicopt[...]

Everything about aircrafts and helicopters. News and events in aviation worldwide. Civil, transportation, military helicopters and airplanes.

Everything about aircrafts and helicopters. News and events in aviation worldwide. Civil, transportation, military helicopters and airplanes.

Everything about aircrafts and helicopters. News and events in aviation worldwide. Civil, transportation, military helicopters and airplanes.

Everything about aircrafts and helicopters. News and events in aviation worldwide. Civil, transportation, military helicopters and airplanes.


As previously discussed with geometric and kinematic similarities, the dynamic similarity can be maintained by scaling up the wing dimension while appropriately lowering the flapping frequency, thereby rendering the Reynolds number and the reduced frequency unchanged. For example, Ellington et al. [199] used a robotic wing model to investigate flow over the wings of a hovering hawkmoth and discovered that the LEV spiraled out toward the wingtip. Their findings provided a qualitative explanation of one particular high-lift mechanism. Dickinson et al. [201] also used a robotic wing model representing a fruit fly to directly measure the forces and visualize the flow patterns around the flapping wing. They demonstrated two force peaks during the rotation phase: (i) the rotational mechanism associated with fast pitch-up and (ii) the wake-capture mechanism resulting from the airfoil and wake interactions. Although different explanations of the two force-generation mechanisms have been offered, as described in the following section, it is clear that a robotic model provides an insightful experimental framework in studying flapping wing flight. Furthermore, Birch and Dickinson [254] observed substantially different
|
Table 3.1. Morphological and flight parameters for selected species
|
flow patterns around the same model used in their previous work [201] at different Reynolds numbers (moths and flies) and investigated the impact of the scaling parameters on the aerodynamic outcome. Further refining the experimental techniques, Fry et al. [228] recorded the wing and body kinematics of free-flying fruit flies performing rapid flight maneuvers with a 3D infrared high-speed video and “replayed” them on their robotic model to measure the aerodynamic forces produced by the wings. They reported that the fruit fly generates sufficient torque for rapid turn with subtle modifications in wing motion and suggested that inertia, not viscous force, dominates the flight dynamics of flies. In addition, numerous studies using flow visualization around biological flyers have been conducted, including smoke visualizations [255]-[260] and particle image velocimetry (PIV) measurements [14] [30] [260]-[269] to understand their flight mechanisms. Furthermore, the advance of such experimental technologies has enabled researchers to obtain not only 2D but also 3D flow structures around biological flyers [262] [266]-[269] and/or scaled models [270]-[272] with reasonable resolution in space. For example, Srygley and Thomas
[256] reported a study on the force-generation mechanisms of free-flying butterflies using high-speed, smoke-wire flow visualizations to obtain qualitative images of the airflow around flapping wings. They observed clear evidences of LEV structures. In comparison, in moth and fly flight, the helical structure and the spanwise, axial flow patterns appear to be much weaker. They suggested that free-flying butterflies use a variety of aerodynamic mechanisms to generate force, such as wake capture, LEVs, active and inactive upstrokes, rapid rotation, and clap-and-fling mechanisms. These different mechanisms, discussed in subsequent sections, are often used in successive strokes as seen during takeoff, maneuvering, maintaining steady flight, and landing.
Warrick et al. [14] used PIV to observe the wake around hovering hummingbirds (see Fig. 1.11). They estimated the aerodynamic force based on the circulation computed by integrating the measured vorticity field and observed an asymmetry in the force between upstroke and downstroke. Specifically, hummingbirds generate 75 percent of the lift during the downstroke and 25 percent during the upstroke. They reported an inversion of the cambered wings during the upstroke, as well as evidence of the formation of LEVs, created during the downstroke. Videler et al. [30] measured the flow around a single swift wing in fast gliding in a water-tunnel experiment using the digital particle image velocimetry (DPIV) technique. Their results show that the gliding swifts can generate stable LEVs at small AoAs (5°- 10°). Whereas the swept-back hand wings generate lift using the LEVs, the flow around the arm wings seems to remain attached.
This discussion presents a sample of experimental and modeling investigations. Clearly, depending on the size and flow parameters of individual species, various lift – enhancement mechanisms are observed. In the following discussion, we address the flapping wing aerodynamics by focusing on the unsteady flow mechanisms, as well as related scaling, geometric, and kinematic parameters. Overall, several unsteady aerodynamic mechanisms associated with flapping wing aerodynamics for force generation have been reported in the literature:
(i) delayed stall of LEVs
(ii) lift peak due to pitch-up rotation
(iii) wake capture due to vortical flow and airfoil interactions
(iv) tip vortex
(v) a persistent downward jet in the wake region
(vi) clap-and-fling mechanism
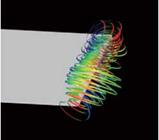
Figure 3.10 displays these mechanisms. In the upper left corner, the wake-capture mechanism, which occurs near the beginning of the translation, is illustrated. This mechanism produces an increase in aerodynamic lift by transferring fluid momentum associated with large-scale vortical flow shed from the previous stroke to the wing at the beginning of each half-stroke. The LEV and its delayed stall are shown in the upper right corner, whereas in the lower right corner, the downward jet is depicted in the wake of a hovering wing. The delayed-stall phenomenon has been investigated from both the dynamic-stall [201] [273] and upper-wing LEV [43] [199] viewpoints. Finally, the tip vortices are shown in the lower left corner via the instantaneous streamlines colored by their vertical velocity components. The impact
 |
|
 |
|
Z-vorticity contours ^
Vertical velocity contours on streamlines
Figure 3.10. Illustration of the time-dependent flow structures affecting the aerodynamics of flapping airfoil during the stroke cycle. Upper left: starting vortices and wake capture. Lower left: tip vortices. Upper right: delayed stall and leading edge vortex. Lower right: jet interaction.
of these mechanisms on the lift and thrust associated with a flapping wing is discussed later.
