Ii. Turbulent flow aerofoils
8.1 PRESSURE DISTRIBUTIONS AT LOW Re
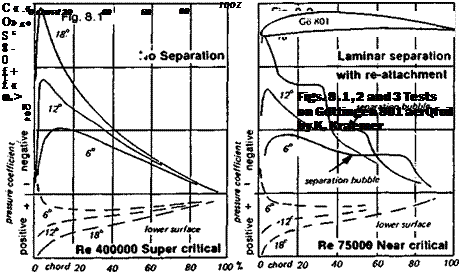
The appearance of a separation bubble on a wing as described in Chapter 3 causes a change in the air pressure and thus affects the lift. It also changes the effective shape of the wing, since the main flow has to accommodate. This changes form drag. There are various techniques for observing, in the wind tunnel, such effects. Tests by K. Kraemer published in 1961 are summarised in Figures 8.1 – 8.3 for the popular model aerofoil, Gottingen 801 (similar to MVA 301). Later research has amply confirmed and extended these results. In these diagrams, the pressure at each point on the upper and lower wing surface is plotted against the chord for several different angles of attack. For positive lift to be developed there must be a substantial difference between the two surfaces. Consider Figure 8.1 first The pressure is plotted as a ratio of the local value to the static value in the mainstream (reduced to coefficient form in this case in the usual way by dividing by VipV2). The reduced pressure on the upper surface is plotted as series of curves generally on the negative side of the graph, while the pressure increase beneath the wing is plotted on the other side of the zero line. At an angle of attack of 6 degrees, pressure on the upper surface falls to a minimum at about 15 percent of the wing chord, and then gradually rises to near the static value at the trailing edge. At 12 degrees the minimum pressure point is further forward and lower, while at 18 degrees the curve reaches its negative ‘peak’ very close to the leading edge and lower still, as could be expected from an aerofoil generating high lift In accordance with Bernoulli’s theorem, flow velocity varies in step with the pressure. The curves give no sign of separation, the aerofoil is working efficiently. At the Reynolds number of 400,000 (wing Re based on chord) the boundary layer makes a natural, unforced transition to turbulent flow somewhere ahead of the minimum pressure point as in Fig. 3.11. At the lower Re of 75,000, well within the model range, a very different pressure pattern is found (Fig. 8.2). At angle of attack 6 degrees, while the pressure minimum is about the same, a section of the curve is flat between about 40 and 76% of the chord. This indicates almost constant pressure over this zone, characteristic of a long separation bubble. However, the boundary layer leaps over the bubble safely and re-attaches. At 12 degrees the peak is further forward as before, the separation bubble is shorter. At 18 degrees the bubble extends over about 30% of the chord, beginning at about 38%. The aerofoil at Re 75,000 is in a near critical condition. It works efficiently though rather less so than at the higher Re. Further reduction of Re has serious effects. These are shown in Figure 8.3. At all angles of attack, complete flow separation occurs a little way behind the minimum pressure point, and there is no re-attachment Some lift is generated, but above an angle of attack of 6 degrees the wing is completely stalled, drag is

extremely high. The aerofoil is clearly unsuitable for use on any model operating in this Re range.


