Our heavyweight helicopter equal in the world does not have
In Rostov started production of the most load-lifting rotary-wing car The Russian holding «Helicopt[...]

Everything about aircrafts and helicopters. News and events in aviation worldwide. Civil, transportation, military helicopters and airplanes.

Everything about aircrafts and helicopters. News and events in aviation worldwide. Civil, transportation, military helicopters and airplanes.

Everything about aircrafts and helicopters. News and events in aviation worldwide. Civil, transportation, military helicopters and airplanes.

Everything about aircrafts and helicopters. News and events in aviation worldwide. Civil, transportation, military helicopters and airplanes.


Aerofoils are no longer designed by ‘cut and try’ methods, but are worked out to fit their special purposes. The first substantial gains achieved were the NACA ‘6’ series aerofoils developed before and during the Second World War. They were used, in slightly modified form, first on the P-З I ‘Mustang’ fighter. These aerofoils were designed to achieve very low profile drag by preserving laminar flow over as much of the wing as possible. The improvements in practice were less than hoped for, because of the inaccuracies of the wings in service, but there were genuine overall benefits. The main method of achieving
Fig. 9.2 cont.
NACA 0009 LE RADIUS 0.89 PERCENT NACA 0010 LE RADIUS 1.10 PERCENT
|
CHORD |
UPPER |
CHORD |
LOWER |
CHORD |
UPPER |
CHORD |
LOWER |
|
STATION |
SURFACE |
STATION |
SURFACE |
STATION |
SURFACE |
STATION |
SURFACE |
|
XU |
YU |
XL |
YL |
XU |
YU |
XL |
YL |
|
0.000 |
0.000 |
0.000 |
0.000 |
0.000 |
0.000 |
0.000 |
0.000 |
|
.600 |
1.010 |
.600 |
-1.010 |
.600 |
1.120 |
.600 |
-1.120 |
|
.800 |
1.170 |
.800 |
-1.170 |
.800 |
1.250 |
.800 |
-1.250 |
|
1.250 |
1.420 |
1.250 |
-1.420 |
1.250 |
1.578 |
1.250 |
-1.578 |
|
2.500 |
1.961 |
2.500 |
-1.961 |
2.500 |
2.178 |
2.500 |
-2.178 |
|
5.000 |
2.666 |
5.000 |
– 2.666 |
5.000 |
2.962 |
5.000 |
– 2.962 |
|
7.500 |
3.150 |
7.500 |
-3.150 |
7.500 |
3.500 |
7.500 |
– 3.500 |
|
10.000 |
3.512 |
10.000 |
-3.512 |
10.000 |
3.902 |
10.000 |
– 3.902 |
|
15.000 |
4.009 |
15.000 |
-4.009 |
15.000 |
4.455 |
15.000 |
-4.455 |
|
20.000 |
4.303 |
20.000 |
-4.303 |
20.000 |
4.782 |
20.000 |
-4.782 |
|
25.000 |
4.456 |
25.000 |
– 4.456 |
25.000 |
4.952 |
25.000 |
-4.952 |
|
30.000 |
4.501 |
30.000 |
-4.501 |
30.000 |
5.002 |
30.000 |
-5.002 |
|
40.000 |
4.352 |
40.000 |
– 4.352 |
40.000 |
4^37 |
40.000 |
-4.837 |
|
50.000 |
3.971 |
50.000 |
-3.971 |
50.000 |
4.412 |
50.000 |
-4.412 |
|
60.000 |
3.423 |
60.000 |
– 3.423 |
60.000 |
3.803 |
60.000 |
– 3.803 |
|
70.000 |
2.748 |
70.000 |
– 2.748 |
70.000 |
3.053 |
70.000 |
– 3.053 |
|
80.000 |
1.967 |
80.000 |
-1.967 |
80.000 |
2.187 |
80.000 |
-2.187 |
|
90.000 |
1.086 |
90.000 |
-1.086 |
90.000 |
1.207 |
90.000 |
-1.207 |
|
95.000 |
.605 |
95.000 |
– .605 |
95.000 |
.672 |
95.000 |
– .672 |
|
100.000 |
.095 |
100.000 |
– .095 |
100.000 |
.105 |
100.000 |
– .105 |
Note that the ordinates of the 9% thick profile are exactly 90% of the 10% profile. NACA four-digit symmetrical sections may alwaysbe scaled up or down to different thicknesses by simple arithmetic.
|
|
|
|
|
|
|
|
|
|
![]()
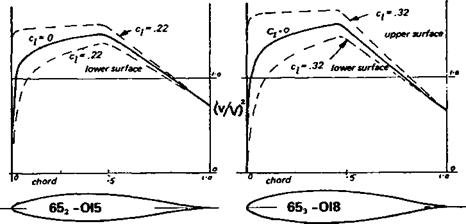
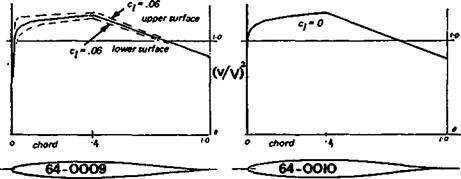
the lower drag was to employ aerofoil thickness forms similar to those shown in Figure 9.3. As the velocity diagrams show, at zero angle of attack the maximum velocity/: minimum pressure point on these profiles is at 40% or 50% of the chord. Other thickness I forms were designed with this point further back or further forward. The second digit of an, NACA profile designation, such as the 4 in 643618, indicates the position of the maximum velocity point The boundary layer, on a suitably smooth wing, will remain : laminar to a point somewhere aft of the 40% chord position on such an aerofoil. (By і suitably smooth is meant a wing free from ripples, humps or hollows rather than one which is highly polished.) As shown in Figure 9.3, at small angles of attack the velocity ‘ distribution on both surfaces is favourable for laminar flow back to the 40% point, the 9% thick profile at ci of.06. The thicker profile, 652015 shows that laminar flow is preserved on both sides up to a ci of 0.22. This is of great importance. A thicker wing at a high angle of attack may have greater percentage of laminar flow and hence lower drag than a thin profile. (Compare also the 653018 profile.) This applies equally to cambered profiles. If j one of the symmetrical sections of Figure 9.3 is cambered round the NACA a = 1 mean line, the basic character of the velocity distribution, and hence laminar flow, is not І changed. Figure 9.4 shows the results in graphical form. The amount of camber given to ‘ the profile is determined by the desired operational Cl, as described in Chapter 7. At this value, laminar flow prevails over both upper and lower surfaces, up to the peak velocity ■: position and slightly beyond it. At a higher angle of attack, the velocity graph resembles that of Figure 9.4(b). Transition on the upper surface occurs futher forward. There may even be flow separation further aft, but this is not important since the aircraft is not intended to operate far from its designed Cl – The result in terms of drag at the design ci of the profile is very substantial improvement