Our heavyweight helicopter equal in the world does not have
In Rostov started production of the most load-lifting rotary-wing car The Russian holding «Helicopt[...]

Everything about aircrafts and helicopters. News and events in aviation worldwide. Civil, transportation, military helicopters and airplanes.

Everything about aircrafts and helicopters. News and events in aviation worldwide. Civil, transportation, military helicopters and airplanes.

Everything about aircrafts and helicopters. News and events in aviation worldwide. Civil, transportation, military helicopters and airplanes.

Everything about aircrafts and helicopters. News and events in aviation worldwide. Civil, transportation, military helicopters and airplanes.


Important new research on model aerofoil section design was carried out at Princeton University between 1986 and 89 by Michael Selig, John Donovan and David Fraser.
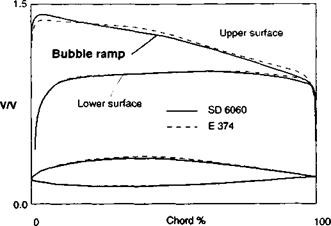
Using the aerofoil design program developed by Eppler and Somers, combined with that of Drela and Giles, which in some respects has been found more accurate for predictive purposes at low Reynolds numbers, a family of entirely new profiles was designed and tested in the Princeton wind tunnel. The theoretical basis of the new series, all carrying the prefix SD followed by a four digit number (e. g., Selig-Donovan SD 7032) is adjustment of the pressure distribution over the upper surface of the profile by introduction of a ‘bubble ramp’. (The SD profiles should be distinguished from the earlier series ‘S’ designed by Selig, mentioned in Section 9.8 above.)
If the transition from falling pressure to rising pressure over the upper surface of the wing is too sudden and the pressure recovery gradient aft too steep, a separation bubble is almost sure to form. If, however, the rising pressure gradient can be smoothed out and made very gradual, transition in the boundary layer from laminar to turbulent flow may be achieved without separation.
The SD profiles for models have the recovery aft of the lowest pressure point carefully
|
Fig. 9.18 Velocity/pressure distributions, SD 6060 compared with Eppler 374 at a lift coefficient of 0.55
|
|
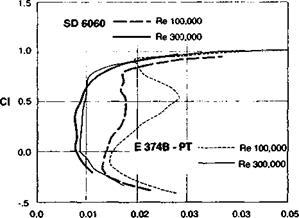
Fig. 9.19 Comparison drag curves for the Eppler 374 and SD 6060 tested at Princeton at two Reynolds numbers
|
Cd
calculated to be as smooth and even as possible with no changes in the rate of change until very close to the trailing edge. The long, gentle pressure recovery zone is termed the bubble ramp. It should be compared with the very abrupt change in the upper surface pressure distribution shown for the NACA 6 Series profiles (Fig. 9.3 above). A comparison of the SD 6060 profile with the well known Eppler 374 is shown in Fig. 9.18. The wind tunnel results show a very worthwhile drag reduction, especially noticeable at the lower Re (Fig. 9.19).
Further brief discussion of the Princeton wind tunnel test work appears in the next chapter.