
Our heavyweight helicopter equal in the world does not have
In Rostov started production of the most load-lifting rotary-wing car The Russian holding «Helicopt[...]

Everything about aircrafts and helicopters. News and events in aviation worldwide. Civil, transportation, military helicopters and airplanes.

Everything about aircrafts and helicopters. News and events in aviation worldwide. Civil, transportation, military helicopters and airplanes.

Everything about aircrafts and helicopters. News and events in aviation worldwide. Civil, transportation, military helicopters and airplanes.

Everything about aircrafts and helicopters. News and events in aviation worldwide. Civil, transportation, military helicopters and airplanes.


As discussed in Sections 2.3 and 3.4, the difference between 2D and 3D flow structures in terms of force generation has important implications for the applicability of 2D computations to approximate a 3D flow field. For example, at Re of 102 for a delayed rotation kinematics, the TiV anchored the vortex shed from the leading edge, thereby increasing the lift compared to a 2D computation under the same kinematics (see Section 3.4.1.1). In contrast, under different kinematics with a smaller AoA and synchronized rotation, the generation of TiVs was small, and the aerodynamic loading was captured by the analogous 2D computation (see Section 3.4.1.2). At Re = 0(103-104) Visbal [328] studied the unsteady separation process in a 3D flow field around a purely plunging flat plate with AR = 2, к = 1.0, and St = 0.16. The implicit LES computations employed by Visbal [328] show the evolution of both the TiV and the LEV. The TiV forms as the flat plate plunges downward, breaks down, and collapses during the first part of the upstroke. Meanwhile the LEV, which is fairly uniform at the early stage of downstroke, experiences intense axial flow toward the center of the wing, eventually evolves into an arch-type vortex, and sheds as a ring vortex, suggesting the 3D nature of the flow at higher reduced frequency and Strouhal number.
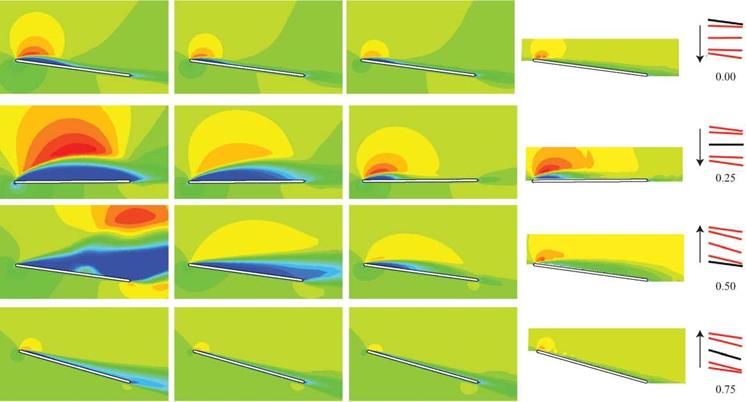
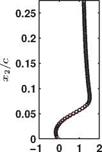
Kang et al. [324] investigated the 3D effects for the flat plate with AR of 2 in shallow stall at Re = 4 x 10⁴. Figure 3.44 illustrates the H1/Um contours from the computations at Re = 4 x 10⁴ and the experimental results obtained at Re = 3 x 10⁴. The flow field is dominated by large leading-edge separation due to the geometric effects in the downstroke as discussed in the previous section. In 3D, the separation is mitigated and the flow reattaches before mid-chord. The velocity field at the center of the downstroke, t/T = 0.25, is further depicted in Figure 3.45 from the 3D computation and experimental measurements at 75 percent span location. The velocity profiles also show the boundary-layer separation at the leading edge and reattachment around xx/cm = 0.25. It should be noted that the experimental measurements were obtained at Re = 3 x 10⁴. The reasonable correlation shown in Figure 3.44 and Figure 3.45 may indicate that the Reynolds number effect is limited, similar to the observation made in Section 3.4.1.2 for the 2D flow around the flat plate.
The absence of the strong leading-edge separation for the flat plate with AR = 2 manifests itself in the aerodynamic force felt on the wing. The time histories of the lift coefficient for both 2D and 3D flat plates in shallow stall are plotted in Figure 3.46. In the upstroke where both flat plates evince attached flow, the lift coefficient shows comparable magnitudes. However, during the downstroke the peak of the lift generated on the 2D flat plate is 2.3 times greater than on its 3D counterpart.
At the center of the downstroke, t/T = 0.25, the effective AoA is at maximum, and the development of the TiV is also significant as illustrated by the iso-surfaces
 |
|||||
|
|
|
|||
|
|
|
||||
|
|||||
 |
|||||
|
|
||||
|
|
|
|||
|
|||||
![]()
Figure 3.45. u1/Uxi profiles at t/T = 0.25 at Re = 4 x 10⁴for the 3D flat plate with AR = 2 in shallow stall at 75% span. Experimental data were performed at Re = 3 x 10⁴. From Kang et al. [324].
of Q in Figure 3.47. This TiV interacts with the LEV developed at the leading edge of the flat plate. Because of the downwash induced from the presence of the TiV, the effective AoA at the leading edge near the tip is smaller than in 2D, which results in a spanwise non-uniform LEV formation that is stronger away from the tip. Consequently, the spanwise lift distribution in 3D is smaller than in 2D as shown in Figure 3.47. Close to the tip of the flat plate a small peak in spanwise lift is shown. A reason for this local maximum is the lower pressure region associated with the presence of the TiV [297]. In contrast, at the center of the upstroke the effective AoA is at minimum, and the flow field has negligible 3D effects such as TiV generation and interactions between TiV and LEV, so that the spanwise lift distribution of 3D is similar to that of 2D.


