Our heavyweight helicopter equal in the world does not have
In Rostov started production of the most load-lifting rotary-wing car The Russian holding «Helicopt[...]

Everything about aircrafts and helicopters. News and events in aviation worldwide. Civil, transportation, military helicopters and airplanes.

Everything about aircrafts and helicopters. News and events in aviation worldwide. Civil, transportation, military helicopters and airplanes.

Everything about aircrafts and helicopters. News and events in aviation worldwide. Civil, transportation, military helicopters and airplanes.

Everything about aircrafts and helicopters. News and events in aviation worldwide. Civil, transportation, military helicopters and airplanes.


In all cases, the raw force measurements coming from the instruments have to be corrected to allow for various defects which cannot be entirely removed from any tunnel. The model, for instance, tends to block the flow through the test section and this* blocking effect varies with the angle of attack. Models of different chord and thickness cause more or less blocking. The constraint of the air by the tunnel walls must be allowed for. If there are any supporting struts or wires, an estimate of their effect on the figures has to be made. Where balances, rather than pressure measurements and wake rakes, are used there are
often small gaps at the ends of the tunnel model, where they must be free to move and not jam against the walls. These gaps may affect results. When the model is fixed to the wall (giving the effect of infinite aspect ratio as mentioned in 6.17), there are problems caused by interference of the flow in die corner. The corrections applied are carefully worked out but are always somewhat approximate. For all these and other reasons, including inaccuracies in models used for testing, the results reported from one wind tunnel always differ to some extent from those originating elsewhere.
While the general pattern of the results emerging is clear enough, small differences in performance between sections tested in different tunnels may not be taken too seriously. Such variations are due to the variations of experimental technique. It is fair to compare Kraemer’s tests of the Go 801 with his test, in the same tunnel, of the Hacklinger designed section, Go 803, or the Go 804, but it is hardly safe to compare the Kraemer results directly with those of Pfenninger or Muessman etc. The importance of Dr Althaus’s results from Stuttgart is that all come from the same tunnel, and may be compared with one another. Yet even when, as in this case, a series of reports have been published from one research laboratory, over a period the test apparatus is likely to have been improved or altered so that results from one early test may not be exactly comparable with a later one.
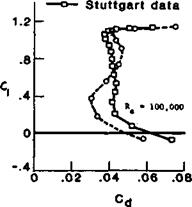 |
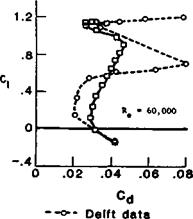
Fig. 10.3 Comparison of drag data from two modern wind tunnels (Eppler 387 aerofoil)
|
ANGLE OF ATTACK. 0 • ” ** I*
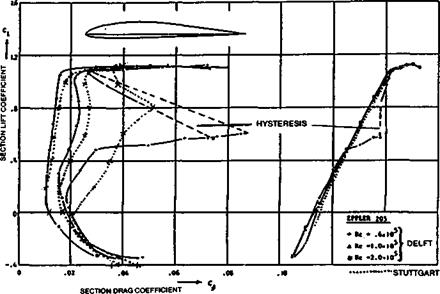
Figure 10.4 Comparison of two different wind tunnel measurements of the Eppler 205 aerofoil. At the highest Re, 200 000, agreement is very good, but it is less good at Re 100 000 and poor at 60 000. The Delft measurements show a pronounced hysteresis loop at Re 60 000, which does not appear in the Stuttgart tunnel. [See Chapter 8, 8.3] The lift curve as well as the drag is shown, as explained in Paragraph 10.5. |
As an example of what may occur when an apparently identical aerofoil is tested in two different laboratories, Figure 10.3 shows the drag polars for the Eppler 387 at Re 60,000 and 100,000, as measured at Stuttgart and Delft. A similar pair of results is shown in Figure 10.4 for the Eppler 205. (See also Appendix 2). The Gottingen 795 aerofoil, which has attracted attention because it seems less affected by low Re numbers than many ofther profiles, has been tested in three separate tunnels, charts from two of which appear in Appendix 2 and the third in Dr. Althaus’s book, Profilpolaren fur den model(flug, Vol. 1. The comparison is left to the reader.