Some Remarks on Simplified Models
The simplified models – such as Theodorsen’s formula for lift, Eq. (3-21) for forward flight, the revised quasi-steady model proposed by Sane and Dickinson [292], or Eq. (3-33) for hover – are very powerful for obtaining a quick estimate of lift generation or for design and optimization purposes, but they do not guarantee the accuracy of the solution. A solution from a Navier-Stokes equation solver would be more accurate, but it would take hours or even days to obtain one single 3D simulation. It is hence of great importance to assess when or why the simplified models give reasonably accurate results.
(a) Pitching and plunging (0.68, 0.89, 0.77) (b) Purely plunging (0.78, 0.79, 0.73)
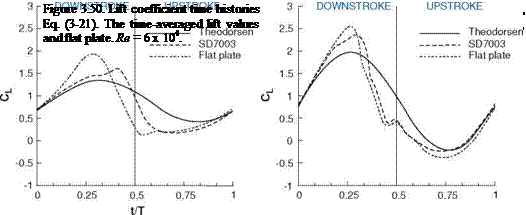
For the shallow stall and deep stall kinematics discussed in Section 3.5, the lift prediction by the Theodorsen formula Eq. (3-21) is plotted against the lift obtained by numerical computations for a 2D SD7003 airfoil and flat plate in Figure 3.50. For the shallow stall case, Theodorsen’s result matches the computations reasonably during the downstroke. The agreement improves in the second part of the upstroke. Although Eq. (3-21) is derived for a thin flat plate, the lift prediction is closer to that of SD7003 airfoil. This difference stems from the formation of LEV for the case of a flat plate as shown in Figure 3.33 during the downstroke. As the LEV convects downstream, the lower pressure region in the vortex core enhances the lift. Subsequently the LEV detaches and the flat plate loses the leading-edge suction. At t/T = 0.5 the discrepancy is the largest where the flow over the SD7003 experiences an open separation [323]. Since Theodorsen’s solution assumes a planar wake and Kutta condition at the trailing edge, the wake structure at t/T = 0.5 violates this condition, causing the discrepancy in the lift coefficient. Overall, Theodorsen’s solution approximates the lift coefficient from the numerical computation better when the wake is planar. In the deep stall, as discussed in Section 3.5 flow over both the SD7003 and flat plate separates early in the downstroke, leading to LEV formation. The resulting flow structures and the time history of lift are similar. Again, Theodorsen’s prediction gives a reasonable estimation, but is less accurate when an LEV is formed.
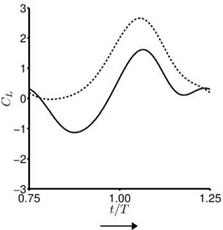
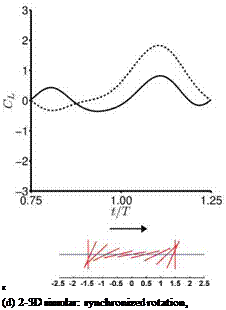
For the hovering flat plates, the quasi-steady lift predicted by Eq. (3-34) is compared to the numerically computed lift of hovering flat plates at Re = 100 for the cases highlighted in Section 3.4. Although the case setup is different (e. g., Dickinson et al. [201] used a revolving 3D wing, whereas Trizila et al. [301] used plunging flat plates), such a comparison highlights the usefulness and the limitations of applying quasi-steady models for design or control purposes. For these cases Eq. (3-34) captures the general trends well, but over-predicts the lift peak during the second part of the stroke, which is reflected in the time-averaged lift coefficients: the quasisteady values are greater than the computed values. Most notable differences are
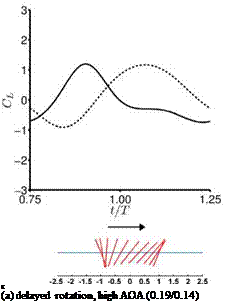
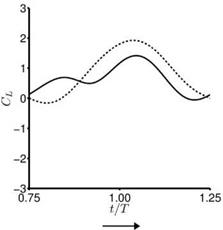
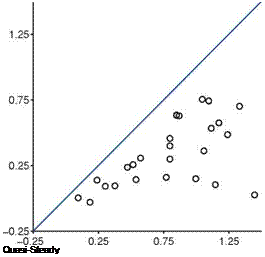
found during the first part of the stroke where the returning flat plate interacts with the wakes shed in the previous stroke, as explained in Section 3.6.2. For the delayed rotation and both the synchronized rotation cases (Fig. 3.51a, c, d), the first lift peak that is due to wake capture is not captured at all by Eq. (3-34). In fact because the airfoil pitches down while accelerating forward, the rotational component, Fr, dominates and yields negative lift. For the advanced rotation case shown in Figure 3.51b, because the interaction with the downward wake [359] is not included in the quasi-steady model Eq. (3-34), the negative portion of the lift between t/T = 0.75 and 1.00 is not captured. The biggest difference in the predicted and computed time-averaged lift coefficient is found for the cases with these kinematics. The global trend is illustrated in Figure 3.52 where the time-averaged lift coefficients for all cases considered by Trizila et al. [301] are plotted with the x-coordinate being the quasi-steady model prediction given in Eq. (3-34) and the у-coordinate the Navier – Stokes computation from Trizila et al. [301]. It is clear that Eq. (3-34) over-predicts the mean lift, and for some cases the error can be huge (e. g., the case shown in Fig. 3.51b).
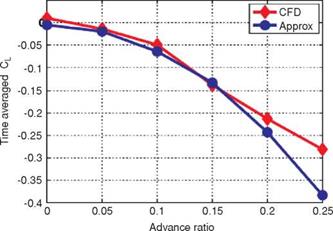
Gogulapati and Friedmann [367] extended Ansari’s unsteady aerodynamic model to forward flight and flexible wings and also incorporated a vorticity decay model to include the effects of viscosity. They compared their results to the numerical results shown in Section 3.4.1 and showed that the correlation indeed improves when the viscosity effects are included. They also investigated the role of LEV shedding. For the case where the 3D flow field is similar to the 2D flow field (Section 3.4), the vortical activity from the leading edge is small, as shown in Figure 3.27. For this case, Gogulapati and Friedmann’s model showed that the best correlation to the Navier – Stokes computations is obtained when an attached flow is assumed: the aerodynamic model is adjusted not to shed any vorticity from the leading edge. In contrast, for the delayed rotation with high AoA and low plunging amplitude case (Section 3.4.1.1), results with LEV shedding agree the best with the Navier-Stokes computations (see Fig. 3.53). For combined pitch and plunging motions in hover it was shown that the forces predicted by the approximate model match Navier-Stokes solutions reasonably well for a Zimmerman wing with the flapping amplitudes of 10° to 15° and the pitching amplitude of 5° and 10°. The motion frequency was fixed at 10 Hz, resulting in the reduced frequency of 1 to 1.5 based on the mean wingtip speed and Re of 0(103). The differences between this approximate model and the Navier-Stokes model were attributed to 3D effects at play, such as TiV generation, LEV-TiV interaction [296], or spanwise flow. Also for flapping Zimmerman wings in forward flight, the flapping amplitude was kept at 35° and the frequency at 10 Hz. By varying the advance ratio and hence the incoming free-stream velocity, they correlated the agreement between their result and the Navier-Stokes solutions to the advance ratio, which is inversely proportional to the reduced frequency. The agreement was more favorable for the higher reduced frequencies (see Fig. 3.54). A plausible reason for this effect is that, as shown in Section 3.6.4 for high reduced frequency and high Reynolds number flows, the added mass force dominates, which is related to the acceleration of the wing. As the reduced frequency decreases, the influence of the vortices in the flow field increases, which is harder to capture by potential theory-based approximate models.
-2.5 -2 -1.5 -1 -0.5 0 0.5 1 1.5 2 2.5 x
 |
(b) advanced rotation, low AOA (1.00/0.15)
 -2.5 -2 -1.5 -1 -0.5 0 0.5 1 1.5 2 2.5 x
(c) synchronized rotation, high AOA (0.85/0.65)
low AOA (0.54/0.14)
Figure 3.51. Lift coefficient during the forward stroke. —, Navier-Stokes equations (Re = 100); —, quasi-steady model as shown in Eq. (3-34). The time-averaged lift coefficients from the quasi-steady model and the computation are indicated in the parentheses.
Figure 3.52. Time-averaged lift coefficients predicted by the quasi-steady model given in Eq. (3-34) on the x-axis and the Navier – Stokes computations on the у-axis for hovering flat plates at Re = 100 [301].
![Подпись: Figure 3.53. Time history of forces from the approximated aerodynamics model [367] and the Navier-Stokes computation [301] for a hovering flat plate at Re = 100 (delayed rotation, high AoA). When the approximate aerodynamic model assumed separated flow, including viscous effects, the agreement improved. From Gogulapati and Friedmann [367].](/img/3131/image329_3.gif) |
Recently, Ol and Granlund [368] considered several flapping rigid-wing experiments in water: (i) a flat plate free to pivot around its leading edge under a periodic translational motion, (ii) linear pitch-ramp motion with varying pivot points, and (iii) a combined pitch-plunge. They conjectured that the aerodynamic force responses are not quasi-steady; that is, the lift is proportional to an effective angle of attack with the proportionality constant being some coefficient (e. g., 2n), but it can be modeled by including the second and the first derivatives of the effective angle of attack. Despite the inherent limitations of linearized aerodynamic models as discussed in this section, research in this area has been popular recently because of these models’ applicability to control applications or design optimizations. As is shown in Section 3.6.2, the quasi-steady model can be significantly improved if one can estimate the
|
Figure 3.54. Time-averaged lift coefficients from the approximated aerodynamics model (blue circle) and the Navier-Stokes computations (red diamond) for a rigid Zimmerman wing in forward flight at Re = 4.6 x 10³, flap amplitude of 35°, and frequency of 10 Hz. The advance ratio is inversely proportional to the Strouhal number and also to the reduced frequency for fixed flap amplitude. From Gogulapati and Friedmann [367]. |
effective angle of attack, instead of the nominal value. For low Reynolds number, flapping wing aerodynamics, the viscous effect is significant, and the interaction between the wing and the surrounding large-scale vertical flows created by the wing motion in the previous and present strokes can noticeably affect the instantaneous actual angle of attack. Thus, in addition to the historical effects of the fluid physics, careful consideration of the quasi-steady framework is required before adopting it as a predictive tool.


