Our heavyweight helicopter equal in the world does not have
In Rostov started production of the most load-lifting rotary-wing car The Russian holding «Helicopt[...]

Everything about aircrafts and helicopters. News and events in aviation worldwide. Civil, transportation, military helicopters and airplanes.

Everything about aircrafts and helicopters. News and events in aviation worldwide. Civil, transportation, military helicopters and airplanes.

Everything about aircrafts and helicopters. News and events in aviation worldwide. Civil, transportation, military helicopters and airplanes.

Everything about aircrafts and helicopters. News and events in aviation worldwide. Civil, transportation, military helicopters and airplanes.


To obtain a complete picture of the performance of any model aircraft in straight flight, a polar curve of the lift-to drag ratio may be calculated and plotted against airspeed. Wind tunnel test resuls are essential for this.
An outline of the method is given in Appendix 1. There are, however, several’ important points to watch. The increasing availability of wind tunnel test results has tempted some modellers to apply these rather crudely, choosing a single test curve for an aerofoil at a Reynolds number approximating that of the model in flight During flight the Reynolds number of a wing is not constant At each airspeed, and on a tapered wing, at
г
|
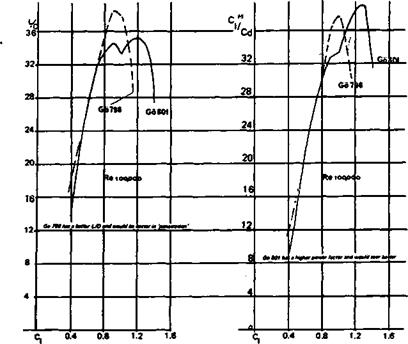
Fig. 10.7 Comparison of two aerofoils
|
Using the calculation methods of Appendix 1, the Power Factor and L/D ratio of a wing profile may be worked out and plotted as shown here. Note: the figures make no allowance for vortex drag. Aspect ratio correction therefore must be applied to arrive at L/D or power factor for the wing.
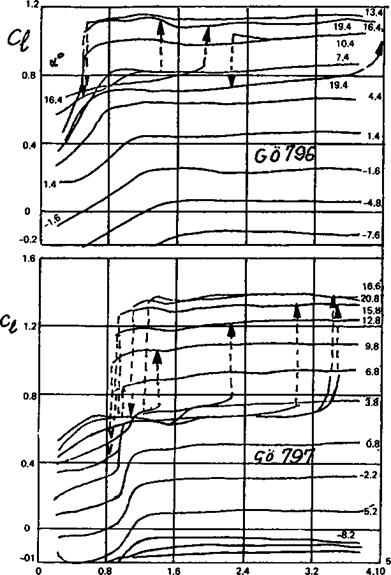
each place along the span, the Re will differ. These variations may be dealt with by constructing, from the basic wind tunnel force curves, diagrams such as those for the G6 796 and 797 (Fig. 10.8). Here, the section lift coefficient at a given angle of attack is read from the tunnel results at each Reynolds number, and plotted as a more or less horizontal line on the charts, with a marked break at the critical Re for that angle and that profile.
Assuming the aircraft is flying at a particular wing Cl its flight speed and hence the average Re number of the wing can be worked out From this, if the wing is tapered, the chord Re at several spanwise points is found by simple proportion. (Twenty span points are usually taken, but the calculations need to be done only for one side, ten points, since the wing is symmetrical about the aircraft’s centre line.) The profile drag of the wing at each point across the span may then be found from charts like those of Figure 10.4, by interpolation, and the wing Co (Profile) is then obtained by integrating all the local section cd coefficients. There then has to be a total wing Co (vortex-induced) drag computation based on the aspect ratio, corrected by the factor к for the planform
|
Fig. 10.8 Plots of Ci variations with Reynolds number for two different aerofoils. The numbers at the right are angles of attack. |
departures from the ellipse (see 5.4), and the wing Cl – To the total of profile drag and vortex drag for the wing alone must be added the parasitic drag coefficients for the rest of the model. Only after this rather lengthy exercise has been completed is the lift/drag ratio at one flight trim discovered. To find the L/D at any other trim requires a complete repetition of the whole work for a different Cl- To construct a polar curve for the aircraft requires all this to be done at least five or six times, with extra work when the exact trim • for best І/D or, with a glider, minimum sinking speed is required. Clearly, very few model enthusiasts will wish to spend the time required to do all this with pencil and paper.
Results of several such exercises by the author, where the work has been done by computer, are listed at the end of this chapter. See also Appendix 1.