Our heavyweight helicopter equal in the world does not have
In Rostov started production of the most load-lifting rotary-wing car The Russian holding «Helicopt[...]

Everything about aircrafts and helicopters. News and events in aviation worldwide. Civil, transportation, military helicopters and airplanes.

Everything about aircrafts and helicopters. News and events in aviation worldwide. Civil, transportation, military helicopters and airplanes.

Everything about aircrafts and helicopters. News and events in aviation worldwide. Civil, transportation, military helicopters and airplanes.

Everything about aircrafts and helicopters. News and events in aviation worldwide. Civil, transportation, military helicopters and airplanes.


Figures 3.56 and 3.57 show the morphological and wing kinematics models of a realistic hawkmoth model. Computations were performed by Liu and co-workers using “a biology-inspired dynamic flight simulator” [387] [388].
3.7.1.1 Vortical Structures and Lift Generation
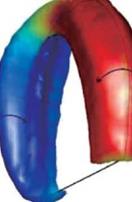
Iso-vorticity-magnitude surfaces around a hovering hawkmoth at selected instants during a flapping cycle are shown in Figure 3.58. The contour color on the iso- vorticity-magnitude surfaces in Figure 3.58 indicates the magnitude of the normalized helicity density. The corresponding time histories of the vertical force on the wings and body are plotted in Figure 3.60.
flow structures during downstroke. In the first half of the downstroke as indicated at point (a) in Figure 3.57, a horseshoe-shaped vortex is generated by the initial wing motion of the downstroke (see Fig. 3.58A-1. Poelma et al. [270] showed a similar 3D flow structure around an impulsively started dynamically scaled flapping wing using PIV (see Fig. 3.59). The horseshoe-shaped vortex is composed of three vortices – an LEV, a TEV, and a TiV – and it grows in size as the translational and angular velocity of the wing increases. These vortices produce a low-pressure region in their core and on the upper surfaces of the wing (Figure 3.61, section 1) when they are attached. Lift forces show a peak at the corresponding time instant (point (b)
![]()
 |

 Doughnut-shaped vortex ring
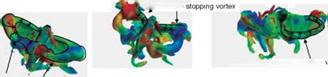
Figure 3.58. Visualization of flow fields around a hovering hawkmoth. Iso-vorticity-magnitude surfaces around a hovering hawkmoth during (a) the downstroke, (b) the supination, and (c) the upstroke, respectively. The color of iso-vorticity-magnitude surfaces indicates the normalized helicity density, which is defined as the projection of a fluid’s spin vector in the direction of its momentum vector, being positive (red) if these two vectors point in the same direction and negative (blue) if they point in the opposite direction.
Figure 3.59. 3D horseshoe-shaped vortex indicated with an iso-Q – surface around an impulsively started wing. The contours on the wing represent the vorticity with its direction indicated by the arrows. From Poelma et al. [270].
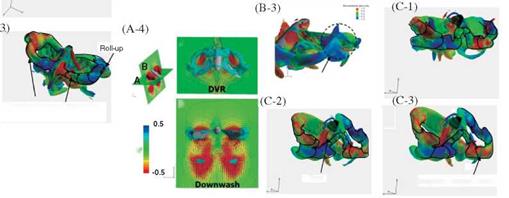
 in Fig. 3.57). As expected, coherent LEVs, TEVs, and TiVs together enhance the lift generation in hovering flight of the hawkmoth. During the mid-downstroke (see point (c) in Fig. 3.57), the TEVs shed mostly from the wings while on the body they stay attached. Moreover, the shed TEVs stay connected to the TiVs (Fig. 3.58A-2). Overall, the LEVs produce the largest and strongest area of low pressure on the wing surface (Fig. 3.61, section 2). Shortly afterward, the LEVs begin to break down at a location approximately 70-80 percent the span of the wing length. At the same time, the LEV, the TiV, and the shed TEV together form a doughnut-shaped vortex ring around each wing (Fig. 3.58A-3). Similar vortex ring structures have been observed around a hovering hummingbird [261] [266], a bat in slow forward flight [268], and a free-flying bumble bee [259]. During the second half of the downstroke (see point (d) in Fig. 3.57), the TiVs enlarge and weaken. As the wings approach the end of the downstroke, both LEVs and TiVs begin to detach from the wings. During most of the downstroke, the doughnut-shaped vortex ring pair has an intense, downward jet flow through the “doughnut” hole, which forms the downstroke downwash (see Fig. 3.58A-4).
While approaching supination (see point (e) in Fig. 3.57), the flapping wing slows down, and the attached vortices are shed from the wings. At this time instant, a pair of downstroke stopping vortices is observed wrapping around the two wings (Fig. 3.58B-1). When the flapping wings begin to pitch quickly about the spanwise axis,
![]()
![]()
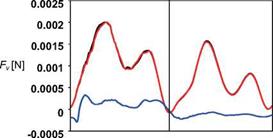
![]() Figure 3.60. Time courses of vertical force of a hovering hawkmoth model over a flapping cycle. t/T = 0-0.5 corresponds to the down – stroke. Black, red, and blue lines represent the aerodynamic forces acting on the right wing, left wing, and body, respectively. The weight of a hawkmoth is around 15.7 x 10³ [N] [384].
Figure 3.60. Time courses of vertical force of a hovering hawkmoth model over a flapping cycle. t/T = 0-0.5 corresponds to the down – stroke. Black, red, and blue lines represent the aerodynamic forces acting on the right wing, left wing, and body, respectively. The weight of a hawkmoth is around 15.7 x 10³ [N] [384].
|
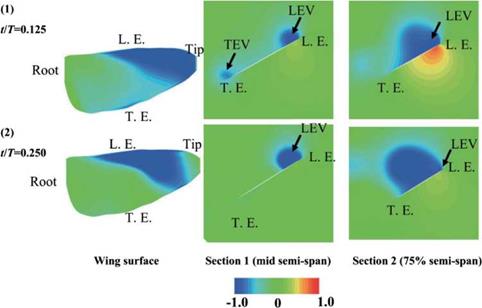
Figure 3.61. Pressure distributions at selected time instants corresponding to Figure 3.57 (b) and (c) during the downstroke. Left: Upper wing surface. Middle: Mid semi-span crosssection. Right: 75% semi-span cross-section from the wing root. Note that L. E. and T. E. indicate leading edge and trailing edge, respectively. Note that the pressure coefficients in the LEV are negative in all sub-figures. |
a pair of upstroke starting vortices is detected around the wingtip and the trailing edge (Fig. 3.58B-2).
flow structures during upstroke. After supination (point (f) in Fig. 3.57), TEVs and TiVs associated with the beginning of the upstroke are generated when the flapping wings rapidly accelerate. The downstroke wakes of the circular vortex rings are subsequently captured (Fig. 3.58B-3), but only a minor impact on lift is seen (Fig. 3.60). As discussed in Section 3.3, the role of the unsteady flow structures on lift enhancement needs to be examined in specific context. As the upstroke starts, (point (g) in Fig. 3.57), the TEVs and TiVs are shed from the two wings (Fig. 3.58C-1). Together with the TEVs, the LEVs and TiVs form a horseshoe-shaped vortex pair wrapping each wing (Fig. 3.58C-2). Similar to what is seen during the downstroke, the horseshoe-shaped vortex grows and evolves into a doughnut-shaped vortex ring for each wing. It should be pointed out that, due to asymmetric variation of the AoA between the upstroke and downstroke, the LEVs generated in the upstrokes are smaller than those in the downstroke. Late in the upstroke (point (h) in Fig. 3.57), the doughnut-shaped vortex rings elongate and deform while maintaining their ring-like shape (Fig. 3.58C-3).
As for the aerodynamic force generation, two peaks in the lift force are predicted during each stroke for a hovering hawkmoth (see Fig. 3.60). Considering the correlation between the aerodynamic forces and the key unsteady flow features associated with flapping wings discussed in Section 3.3, the delayed stall of the LEV and contributions from the TEV and TiV are responsible for the first lift peak. The
second peak is likely to be associated with a contribution from the rapid increase in vorticity [289] as the wing experiences a fast pitching motion.