Pitch and roll response to cyclic pitch control inputs
In Chapter 2 we discussed the mechanism of cyclic pitch, cyclic flapping and the resulting hub moments generated by the tilt of the rotor disc. In Chapters 3 and 4, the aeromechanics associated with cyclic flapping was modelled in detail. In this section, we build on this extensive groundwork and examine features of the attitude response to cyclic pitch, chiefly with the Helisim Bo105 as a reference configuration. Simulated responses have been computed using the full nonlinear version of Helisim with the control inputs at the rotor ($1s and 01c), and are presented in this form, unless otherwise stated.
Response to step inputs in hover – general features
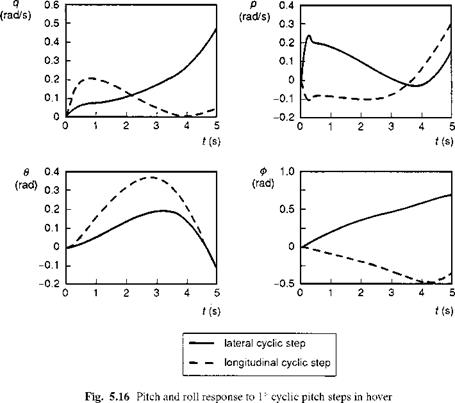
Figure 5.16 shows the pitch and roll response to 1° cyclic step inputs at the hover. It can be seen that the direct response after 1s, i.e., q to 01s and p to 01c, has a similar magnitude
|
|
for both pitch and roll – in the present case about 12°/s per deg of cyclic. However, while the hub moments and rate sensitivities (i. e., the steady-state rate response per degree of cyclic) are similar, the control sensitivities and dampings are scaled by the respective inertias (pitch moment of inertia is more than three times the roll moment of inertia). Thus the maximum roll rate response is achieved in about one-third the time it takes for the maximum pitch rate to be reached. The short-term cross-coupled responses (q and
p) exhibit similar features, with about 40% of the corresponding direct rates (p and
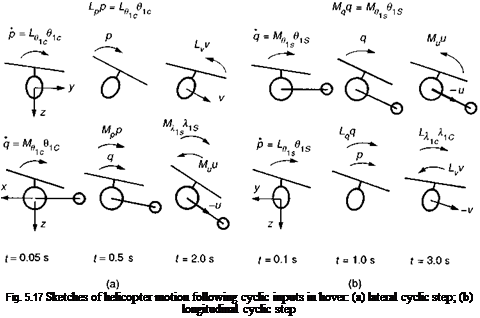
q) reached less than 1 s into the manoeuvre. The accompanying sketches in Fig. 5.17 illustrate the various influences on the helicopter in the first few seconds of response from the hover condition. The initial snatch acceleration is followed by a rapid growth to maximum rate when the control moment and damping moment effectively balance. The cross-coupled control moments are reinforced by the coupled damping moments in the same time frame. As the aircraft accelerates translationally, the restoring moments due to surge and sway velocities come into play. However, these effects are counteracted by cross-coupled moments due to the development of non-uniform induced velocities normal to the rotor disc (A. is and A. ic). After only 3-4 s, the aircraft has rolled to nearly 30° following either pitch or roll control inputs, albeit in opposite directions. Transient motion from the hover is dominated by the main rotor dynamics and aerodynamics. In the very short time scale (<1 s), the attitude response is strongly influenced by the rotor flapping dynamics and we need to examine this effect in more detail.
 |
Effects of rotor dynamics
The rotor theory of Chapter 3 described three forms of the multi-blade coordinate representation of blade flap motion – quasi-steady, first-and second order. Figure 5.18 compares the short-term response with the three different rotor models to a step lateral cyclic input in hover. The responses of all three models become indistinguishable after about 1 s, but the presence of the rotor regressing flap mode (Bo105 frequency approximately 13 rad/s – see Chapter 4) is most noticeable in the roll rate response in the first quarter of a second, giving rise to a 20% overshoot compared with the deadbeat response of the quasi-steady model. The large-scale inset figure shows the comparison over the first 0.1s, highlighting the higher order dynamic effects, including the very fast dynamics of the advancing flap mode in the second-order representation. With rotor dynamics included, the maximum angular acceleration (hence hub moment) occurs after about 50 ms, or after about 120° rotor revolution for the Bo105. The quasisteady approximation, which predicts the maximum hub moment at t = 0, is therefore valid only for low-frequency dynamics (below about 10 rad/s). We have already seen earlier in this chapter how rotor dynamics have a profound effect on the stability of the rotor/fuselage modes under the influence of strong attitude control. This is a direct result of the effective time delay caused by the rotor transient shown in Fig. 5.18. Unless otherwise stated, the examples shown in this section have been derived using the first-order rotor flap approximation.


