Our heavyweight helicopter equal in the world does not have
In Rostov started production of the most load-lifting rotary-wing car The Russian holding «Helicopt[...]

Everything about aircrafts and helicopters. News and events in aviation worldwide. Civil, transportation, military helicopters and airplanes.

Everything about aircrafts and helicopters. News and events in aviation worldwide. Civil, transportation, military helicopters and airplanes.

Everything about aircrafts and helicopters. News and events in aviation worldwide. Civil, transportation, military helicopters and airplanes.

Everything about aircrafts and helicopters. News and events in aviation worldwide. Civil, transportation, military helicopters and airplanes.


1.3.1 Fixed Membrane Wing
Much of the earlier efforts in membrane wing studies focused on fixed-wing-based vehicles [207]. Of particular importance to the membrane wing MAVs is the passive ability of the wing skin to change shape to reflect flight conditions. Shyy et al. [408] provided a comprehensive review of MAV performance characteristics, with particular emphasis on the effects of low AR and AoA on TiVs, laminar boundary-layer separation, stall characteristics, and vibrations in MAVs. Ifju et al. [17] presented methods for design and construction of a variety of flexible wing MAVs and demonstrated that the adaptive nature of the flexible wing design greatly improved stability and reduced drag.
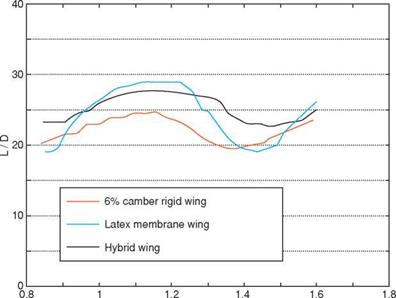
Shyy et al. [456] compared the performance between a low Reynolds number membrane and rigid airfoil in terms of the lift-to-drag ratio. They investigated three airfoils – one rigid, one membrane based, and the third a hybrid of both – of the same nominal camber at 6 percent in a fluctuating free-stream. To mimic the effect of wind gust the fluctuations in the free-stream were modulated for 25 percent or more, and the sinusoidal modulation frequency of the free-stream was 1.7 Hz. The linear membrane model was used to account for the airfoil’s flexibility. The hybrid airfoil was built with a curved wire screen beneath the membrane, so that it could achieve a camber deformation greater than 6 percent, but not less because the wire construction prevented a decrease in the camber. The size of the wing chords and the average wind tunnel speed gave a Reynolds number of 7.5 x 10⁴. The experiments for all three airfoils were conducted at an AoA of 7° and the results are shown in Figure 4.14. Detailed numerical simulations based on the Navier-Stokes equations and two-equation turbulence closure, along with a moving grid technique to track the shape variations of the membrane and hybrid airfoils, were conducted for various configurations.
Shyy et al. [456] found that, at modest AoA, the flow over the rigid airfoil is attached to the surface at all time and the lift-to-drag ratio follows the free-stream fluctuations. When the AoA is increased to 7° substantial flow separations occur, causing a modification to the effective shape of the rigid airfoil. As the AoA is
|
Time (seconds) Figure 4.14. Experimental L/D results for rigid, flexible, and hybrid wings at Re = 7.5 x 10⁴ and AoA = 7°. The latex membrane wing exhibits about 6% camber at 35.4 fps. The hybrid wing has a curved-wire screen camber stop. From Shyy et al. [456]. |
increased, CL tends to increase as well, but the lift-to-drag ratio decreases due to flow separation. When the flow is separated at higher AoAs, the airfoil is less sensitive to an unsteady free-stream. At both AoAs, the lift coefficients between rigid and flexible airfoils are comparable, but the lift-to-drag ratio is higher for the flexible airfoil. For the membrane airfoil, at AoA=7° the flow separation is confined to the leading edge, resulting in a better aerodynamic performance. However, some negative effects occur with the flexible membrane. When the free-stream velocity reached its lower values during a fluctuating cycle, the camber of the flexible membrane tends to collapse, and a massive separation over the whole surface occurs. This phenomenon is due to the smaller pressure differences between the upper and lower surface of the membrane, and hence a degraded performance is obvious.
The hybrid airfoil, which has a curved wire screen stop to prevent the camber from becoming too low, shows interesting results. For a lower AoA the aerodynamic characteristics associated with a hybrid wing are essentially the same as for those with a flexible airfoil because the flow field near the wing is non-separating. However, when the AoA is increased, the characteristics are considerably better for the hybrid airfoil compared to the flexible profile. The separation zone is smaller, compared to the rigid airfoil, and the sensitivity to fluctuations in the free-stream is reduced when compared to the flexible configuration.
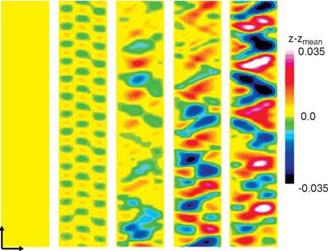
A computational study [469] of unsteady structural response of the membrane airfoil is shown in Figure 4.15i. This figure displays the membrane oscillations by means of x-t diagrams showing the difference between the instantaneous and mean membrane deflection. The membrane is nominally stationary at AoA = 4° because the flow is steady over the major portion of the airfoil (see Fig. 4.15ii). At
|
|
|
|
|
|
|
|
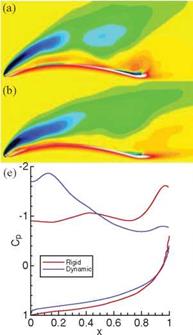
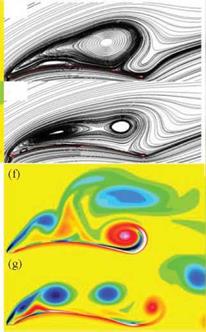
Figure 4.16. Comparison of the rigid (a, c,f) and dynamic (b, d,g) membrane airfoil solutions for AoA = 20°: a, b) mean vorticity, c, d) mean streamlines, e) surface pressure coefficient, f, g) instantaneous vorticity. From Gordnier [469].
AoA = 8°, a third mode standing wave response develops. At the higher AoAs (12°~20°), the membrane structural response exhibits a less regular behavior resulting from a combination of structural modes. The maximum peak-to-peak amplitude of the deflection grows with increasing AoA values of an order 0.07 times the chord.
To understand the effects of the motion of the membrane on the flow field, a computational investigation [470] was conducted for a rigid membrane at AoA = 20°. Figure 4.16 compares the mean and unsteady solutions for these two cases. The mean solutions for the rigid (Fig. 4.16a and c) and dynamic (Fig. 4.16b and d) cases show that the flow field around the rigid membrane exhibits a larger and stronger stall vortex and also a larger secondary separation bubble located farther downstream on the airfoil between x = 0.171 to x = 0.44. There is also a region of strong vorticity of the opposite sign near the trailing edge associated with the roll-up of a vortex. This notable difference between the rigid and dynamic mean flow results from a distinct change in the unsteady flow field as illustrated in Figure 4.16f and g. The dynamic motion of the membrane excites the separating shear layer at the leading edge, causing it to roll up sooner and to form a series of smaller vortices (Fig. 4.16g). The TEV in the dynamic case is also reduced in strength and tends to form downstream and away from the trailing edge, which reduces its influence on the airfoil. These changes between the rigid and dynamic flow fields lead to a different mean pressure distribution around the airfoil. This difference is greater on the upper surface where the rigid case exhibits a flat pressure distribution characteristic of a fully stalled flow, except near the trailing edge where the influence of the TEV is observed. In contrast, the dynamic case shows a strong suction region over the front
portion of the wing but higher values of pressure downstream. The overall impact of the dynamic motion therefore appears to be a delay in the airfoil stall with an 8 percent increase in lift and a 15 percent reduction in drag compared to the rigid wing. Further investigation of the impact of the dynamic structural response on the overall aerodynamics is warranted, because it may provide a means for passively controlling the flow to provide improved airfoil performance through judicious aeroelastic tailoring.
Termed adaptive washout by Albertani et al. [457], this effect has been shown to reduce drag, give improved stall behavior, and allow for passive gust rejection. Several factors dictate the in-flight performance of a membrane wing MAV, including skeletal layout, stiffness, and membrane prestrain. The effect of batten thickness and spacing on MAVs during flight was investigated by Abudaram et al. [458], who showed that thin (less stiff) battens led to reduced wing bending and adaptive washout. Rojratsirikul et al. [459] investigated experimentally the effect of membrane prestrain and excess length on the fluid-structure interaction of 2D membrane airfoils. They tested the airfoils with prestrains of 0, 2.5, and 5 percent at AoAs varying from 9-30° and flow velocities of 5,10, and 15 m/s (Re = 5 x 10⁴ ~ 1.5 x 10⁵). Time-averaged membrane tension was dominated by membrane pretension for low – flow velocities, gradually increasing to a uniform value for all cases of pretension. This study also indicated that models with pretension exhibited large flow-separation regions.
Hui et al. [460] studied the effect of structural stiffness on the aerodynamic response of MAVs (Re = 7 x 10⁴). They constructed five MAVs using identical airfoils; the first was made entirely of unidirectional carbon fiber to serve as a rigid basis, whereas the remaining four were constructed to be batten-reinforced membrane MAVs. The number of battens varied between the models: 1,2,3, and 10. They analyzed the aerodynamic performance of the various structures in conjunction with PIV measurements. The results showed that batten-reinforced membrane MAVs of extremely low stiffness, such as the one-batten model, are too flexible to maintain the airfoil shape during flight and provide the lowest L/D of any of the models. The remaining batten-reinforced models provide delayed stall, reduced drag, and higher L/D compared to the rigid airfoil wing models. It was also shown that a significant increase in battens, and therefore stiffness, as in the case of the 10-batten model, provides very similar aerodynamic performance to the rigid airfoil model. PIV measurements showed that at AoA > 10°, the rigid airfoil undergoes flow separation, whereas the batten-reinforced models deforms, reducing the effective AoA and allowing flow to stay attached longer. Vibrations of the membrane skins of BR models are noted for low AoA (<10°).
Lian and Shyy [154] compared the aerodynamic performance of a rigid wing to that of a batten-reinforced MAV using computations and showed that they have a comparable prestall performance, whereas the membrane MAV demonstrates delayed stall and increased lift after stall. Stanford et al. [461] characterized the deflection of a membrane wing using a steady-state computation. They compared the computed membrane MAV pressure distributions and static structural deflections to the visual image correlation (VIC) results. They identified Hooke’s law as an accurate means of approximating the prestress of the stretched membrane, despite latex rubber’s hyperelastic material properties.
Galvao et al. [462] measured the lift, drag, and deflection of a compliant rectangular membrane wing at a Reynolds number range of 7 x 10⁴ to 2 x 10⁵ and a AoA range from -5° to 60°. The wing was composed of a compliant latex membrane held between two stainless steel posts located at the leading and trailing edges. They tested four wing models in total: a thin non-compliant wing composed of steel shim stock (denoted RW02 in Figs. 4.17 and 4.18), two compliant membrane wings using latex rubber sheets of thickness 0.25 mm and 0.15 mm (denoted EW01 and EW006 in Figs. 4.17 and 4.18, respectively), and a latex membrane wing (0.25 mm thick) in which the membrane is given 6 percent slack (denoted EW01s in Figs. 4.17 and 4.18). Figure 4.17 depicts the lift coefficient for the test. The compliant wings have greater lift slope than the rigid wing, and the thinner compliant wing has greater lift slope than the thick compliant wing. Wing deflection measurements show that this greater lift slope is due to the increased camber for the compliant wing; this is consistent with the numerical results [158]. The thinner compliant wing stretches to a greater degree
than the thicker membrane and therefore has a larger camber at the same AoA, resulting in a larger lift coefficient. Whereas Figure 4.8 shows that membrane wings have a similar lift slope to the rigid wing, Figure 4.17a indicates that flexible wings have a greater lift slope than a rigid wing. The seemingly contradictory conclusion is due to different experimental setups. Figure 4.8 is based on measurement of a MAV with a free trailing edge, which can be tilted up under forces [406]. As pointed out by Lian and Shyy [154], this trailing-edge deflection reduces the effective AoA.
The interplay among the camber, effective AoA, and the lift can be complicated. Before stall, the flexible structure in the experiments by Waszak et al. exhibits smaller effective AoA because the trailing edge is not fixed and the effective camber is reduced accordingly. In contrast, in the experiment of Galvao et al. [462], the trailing edge is fixed, resulting in a higher camber. They reported that a compliant wing can delay stall by 2 to 8 degrees of AoA, which is qualitatively consistent with the observation of Waszak et al. [406]. After stall, the lift coefficients for the compliant wings decrease in a more attenuated manner compared to the rigid wing. Close to the stall, the camber of the wing is observed to decrease. The de-cambering decreases the severity of the separation, thus delaying the sharp drop in lift force. This behavior enables the wing to sustain high lift at high AoAs. Furthermore, the compliant wings generate more lift at AoAs from 5° to 55°. The compliant wings are also found to yield more drag (Fig. 4.17) for two possible reasons. First, the enlarged camber increases the form drag. Second, the high-frequency fluctuation and vibration heighten the drag. This vibration becomes more noticeable when the trailing edge is not fixed, possibly leading to flutter. As we have explained before, during slow – forward flight, bats can only flex their wings slightly to avoid flutter. The compliant wings also demonstrate their superiority in terms of power efficiency (CL3/2/CD) over a wide range of AoAs (Fig. 4.18a) [462]. This becomes more evident at higher AoAs. However, in terms of flight range efficiency (CL/CD), compliant wings have comparable performance to the rigid wing (Fig. 4.18b).
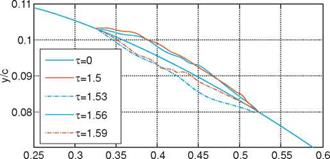
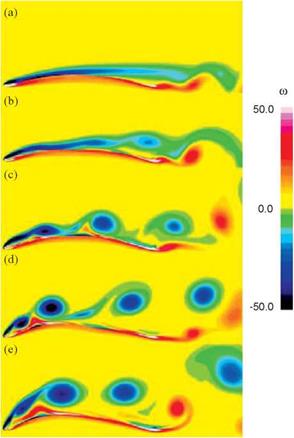
Lian and Shyy [463] numerically investigated the flexible airfoil aerodynamics. In their test, the upper surface of the airfoil is covered with a membrane that extends from 33-52 percent of the chord. No pretension is applied to the membrane. The membrane has a uniform thickness of 0.2 mm with a density of 1200 kg/m3 and is considered as hyperelastic material. A computational test is performed at AoA = 4° and Re = 6 x 10⁴. It is observed that when flow passes the flexible surface, the surface experiences self-excited oscillation and the airfoil displays varied shape over time (Fig. 4.19). Analysis shows that the transverse velocity magnitude can reach as much as 10 percent of the free-stream speed (0.3 m/s). During the vibration, energy is transferred from the wall to the flow, and the separated flow is energized. Compared with corresponding rigid airfoil simulation, the surface vibration causes both the separation and transition positions to exhibit a standard variation of 6 percent of the chord length.
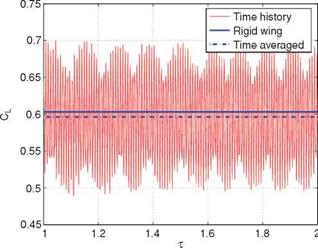
Figure 4.20 presents the time history of the lift coefficient for the membrane wing. Even though the time-averaged lift coefficient 0.60 of a flexible wing is comparable to that of the corresponding rigid wing, the membrane wing lift coefficient displays a time-dependent variation, with a maximum magnitude as much as 10 percent of its mean. The drag coefficient shows a similar pattern, but the time-averaged value closely matches that of the rigid wing. These observations are consistent with
|
x/c Figure 4.19. Membrane airfoil shapes in a steady tree-stream at different time instants. The vibration changes the effective wing camber, where т is the non-dimensional time, defined by tc/U [463]. |
previous efforts in 3D MAV wing simulations, without transitional flow models [154]. Furthermore, the experimental evidence also supports that, until the stall condition is reached, the membrane and rigid wings exhibit comparable aerodynamic performance. The flexible wing, in contrast, can delay the stall margin substantially [406] [462]. Using discrete Fourier transformation analysis the primary frequency of this flexible airfoil is found to be 167 Hz (Fig. 4.21). Given the airfoil chord (0.2 m) and free-stream speed (0.3 m/s), this high vibration frequency is unlikely to affect the vehicle stability. Figure 4.20 indicates that a low-frequency cycle exists in the high – frequency behavior in the lift coefficient history. This cycle, with a frequency of about 14 Hz, seems to be associated with the vortex shedding (Fig. 4.22). In a different simulation with laminar flow over a six-inch membrane wing (i. e., the entire wing surface is flexible), Lian and Shyy observed a self-excited structural vibration with a frequency around 120 Hz [154]; the experimental measurement of similar wings records a primary frequency around 140 Hz [406].
|
Figure 4.20. Time history of lift coefficient for membrane wing, showing both a high – and a low-frequency oscillation [463]. |
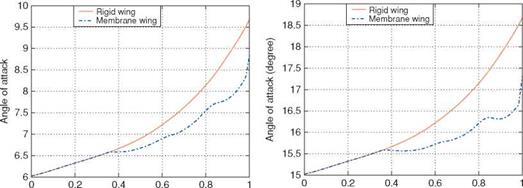
Lian et al. [160] compared the aerodynamics between membrane and rigid wings for MAV applications. The flexible wing exhibits slightly less lift coefficient than the rigid one at AoA = 6°. The difference in CL/CD is also small. At a higher AoA of 15°, the membrane wing generates a lift coefficient about 2 percent less than the rigid wing; however, its CL/CD is slightly larger than that of the rigid wing. This observation is consistent with the findings of Shyy et al. [456]. The membrane wing changes its shape under an external force. This shape change has two effects: it decreases the lift force by reducing the effective AoA of the membrane wing, and it increases the lift force by increasing the camber. Both the numerical findings of Lian and Shyy [158] and the experimental observations of Waszak et al. [406] show that membrane and rigid wings exhibit comparable aerodynamic performance before the stall limit. Figure 4.23 shows the time-averaged vertical displacement of the trailing edge. The displacement is normalized by the maximal camber of the wing. Due to the membrane deformation, the effective AoA of the membrane wing is less than that of the rigid wing. The spanwise AoAs between rigid and membrane wings under the same flow condition and with identical geometric configurations are shown in Figure 4.24. In Figure 4.24a, the rigid wing has an incidence of 6° at the root and monotonically increases to 9.5° at the tip. The membrane wing shares the same AoAs with the rigid wing in the 36 percent of the inner wing; however, the effective AoA toward the tip is less than that of the rigid wing. At the tip, the AoA of the membrane wing lowers by about 0.8°. Figure 4.24b compares the time-averaged spanwise AoA at AoA = 15°, showing that the effective AoA of the membrane wing is more than 1° less than that of the rigid wing at the tip. The reduced effective AoA causes the decrease in the lift force.
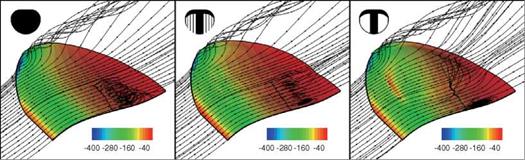
In an attempt to understand the aerodynamics/aeroelasticity aspects of membrane wings, Shyy et al. [455], Stanford and Ifju [464], and Stanford et al. [407] studied a rigid wing and two flexible fixed wing MAV structures. The first of the flexible wing MAV has membrane wings with several chordwise batten structures and a free trailing edge for geometric twist (batten-reinforced [BR] wings). The second has membrane wings whose interior is unconstrained and is sealed along the perimeter to a stiff laminate for aerodynamic twist (perimeter-reinforced [PR] wings). Typical flow structures for all three wings are shown in Figure 4.25 for an AoA = 15° and
|
Spanwise z/Z Spanwise z/Z Figure 4.24. Time-averaged spanwise AoA for membrane wing: (a) AoA = 6°; (b) AoA = 15° [463]. |
UTO = 15 m/s. The two hallmarks of MAV aerodynamics can be seen from the flow over the rigid wing: the low Reynolds number (105) causes the laminar boundary layer to separate against the adverse pressure gradient at the wing root, and the low aspect ratio (AR = 1.2) forces a strong TiV swirling system, leaving a low-pressure region at the wingtip. Flow over the flexible BR wing is characterized by pressure undulations over the surface [465], where the membrane inflation between each batten redirects the flow. The shape adaptation decreases the strength of the adverse pressure gradient and thus the size of the separation bubble. A large pressure spike develops over the PR wing at the leading edge of the membrane skin. The pressure recovery over the wing is shifted aftward, and the flow separates as it travels down the inflated shape, where it is then entrained into the low-pressure core of the TiV. This interaction between the TiVs and the longitudinal flow separation is known to lead to unsteady vortex destabilization at high AoA [167]; no such relationship is obvious for the BR and rigid wings. The low-pressure regions at the wingtips of the two membrane wings are weaker than those observed on the rigid wing, presumably due to energy considerations: strain energy in the membrane may remove energy from the lateral swirling system. Furthermore, the inflated membrane shape may act as a barrier to the tip vortex formation.
|
Figure 4.25. Streamlines and pressure distributions (Pa) over the top wing surface: AoA = 15°, UOT = 15 m/s [407]. |
 |
 |
The lift, drag, and pitching moment coefficients for these three wings through an а-sweep are shown in Figure 4.26. The CL-a relationships are mildly non-linear (20-25 percent increase in CL between 0° and 15°) due to growth of the low-pressure cells at the wingtip. Further characteristics of a low AR are given by the high stall angle, computed as being 21° for the rigid case. The aerodynamic twist of the PR wing increases CL (by as much as 8 percent), making the MAV more susceptible to gusty conditions. CL, max is slightly higher as well, subsequently lowering the stall angle to 18°. The adaptive washout of the BR wing decreases CL (by as much as 15 percent over that of the rigid wing), though the change is negligible at lower AoAs. This decrease is thought to be a result of two offsetting factors: the adaptive washout at the trailing edge decreases the lift, while the inflation of the membrane toward the leading edge increases the effective camber, and hence the lift.
Comparing the drag polars of Figure 4.26, it can be seen that both flexible wings incur a drag penalty at small lift values, indicative of the aerodynamically non-optimal shapes assumed by the flexible wings, although the BR wing has less drag at a given AoA [466]. The drag difference between the rigid and the BR wing is very small, while the PR wing displays a larger penalty. This larger penalty is presumably due to two factors: a greater percentage of the wing experiences flow separation, and a large portion of the pressure spike at the leading edge is pointed in the axial direction. Pitching moments (measured about the leading edge) have a negative slope with both CL and AoA, as necessitated by stability requirements. Non-linear trends due to low AR effects are again evident. Both the BR and the PR
![]()
![]()
![]()
![]()
![]()
![]()
![]()
![]()
![]()

![]()
![]()

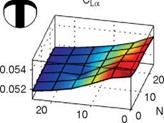
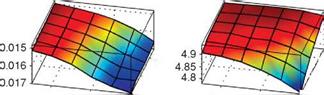
![Подпись: Figure 4.27. Aeroelastic tailoring of chordwise (Nx) and spanwise (Ny) membrane prestress resultants (N/m): contour represents z-axis values [407].](/img/3131/image425_4.gif)
![]()
 |
 |
20 10
0 Nx
wings have a lower 9Cm/dCL than the rigid wing, though only the PR wing shows a drastic change (by as much as 15 percent) as a result of the membrane inflation, which shifts the pressure recovery toward the trailing edge, adaptively increasing the strength of the restoring pitching moment with increases in lift/AoA [461]. Steeper Cm slopes indicate larger static margins: stability concerns are a primary target of design improvement from one generation of MAVs to the next. The range of flyable center of gravity (CG) locations is generally only a few millimeters long; meeting this requirement represents a strenuous weight management challenge. Furthermore, the PR wing displays a greater range of linear Cm behavior, possibly because the adaptive membrane inflation quells the strength of the low-pressure cells, as discussed earlier. No major differences appear between the L/D characteristics of the three wings for low AoAs. At moderate angles, the large drag penalty of the PR wing decreases the efficiency, while the BR wing slightly outperforms the rigid wing. At higher angles, both the lift and drag characteristics of the PR wing are superior to the other two, resulting in the best L/D ratios.
Aeroelastic tailoring conventionally uses unbalanced laminates for bend/twist coupling, but the pretension within the membrane skin has an enormous impact on the aerodynamics: for the 2D case, higher pretension generally pushes flexible wing performance to that of a rigid wing. For a 3D wing, the response can be considerably more complex, depending on the nature of the membrane reinforcement. Effects of increasing the membrane pretension may include a decrease in drag, decrease in CL, linearized lift behavior, increase in the zero-lift AoA, and more abrupt stalling patterns. Furthermore, aeroelastic instabilities pertaining to shape hysteresis at low AoAs can be avoided with specific ratios of spanwise-to-chordwise pretensions [467].
Increasing the prestress within the membrane skin of a BR wing (Fig. 4.27) generally increases CLa, decreases Cma, and decreases L/D. The system is very
sensitive to changes in the prestress normal to the battens and less so to the stress parallel to the battens, due to the zero prestress condition at the free edge. Minimizing CLa (for optimal gust rejection) is found with no prestress in the span direction and a mild amount in the chord direction. The unconstrained trailing edge eliminates the stiffness in this area (allowing for adaptive washout), but retains the stiffness toward the leading edge, removing the inflation seen there (and the corresponding increase in lift). Such a tactic reduces the conflicting sources of aeroelastic lift seen in a BR wing. Maximizing CLa (for effective pull-up maneuvers, for example) is obtained by maximizing Ny and setting Nx to zero. Conversely, maximizing CLa with a constraint on L/D might be obtained by maximizing Nx and setting Ny to zero. Opposite trends are seen for a PR wing. Increasing the prestress within the membrane skin generally decreases CLa, increases Cma, and increases L/D. The chordwise prestress has a negligible effect on the stability derivatives, though both directions contribute equally to an improvement in L/D. As such, optimization of either derivative with a constraint on L/D could easily be provided by a design with maximum chordwise pretension and a slack membrane in the span direction. Overall sensitivity of the aerodynamics to the pretension in the membrane skin of a BR or a PR wing can be large for the derivatives (up to a 20 percent change in the Cma of a BR wing), though less so for the wing efficiency. Variations in L/D are never more than 5 percent.
More recently, membrane wing MAVs have been developed and tested to determine the structural response of BR membrane wings for varying conditions: small AoAs, number of battens, and membrane pretension [468]. A self-excited instability (flutter) was noted for each model with limit cycle oscillations occurring post-flutter flow velocities. These experiments showed that increasing the membrane pretension and the number of structural battens for the membrane wing MAVs delays the flutter velocity and reduces the magnitude of limit cycle oscillations at a given flow velocity.