Our heavyweight helicopter equal in the world does not have
In Rostov started production of the most load-lifting rotary-wing car The Russian holding «Helicopt[...]

Everything about aircrafts and helicopters. News and events in aviation worldwide. Civil, transportation, military helicopters and airplanes.

Everything about aircrafts and helicopters. News and events in aviation worldwide. Civil, transportation, military helicopters and airplanes.

Everything about aircrafts and helicopters. News and events in aviation worldwide. Civil, transportation, military helicopters and airplanes.

Everything about aircrafts and helicopters. News and events in aviation worldwide. Civil, transportation, military helicopters and airplanes.


While flying and controlling an airplane, the human pilot must be using some strategy for flight operation. The human operator/pilot can be regarded as one of the controllers in the overall man-machine/aircraft interaction systems. In the pilot – aircraft system (PAS) to evaluate HQs, the human pilot’s mathematical model would play an important role. This math model describes the control behavior of the human pilot. Manual control tasks that a pilot is called upon to perform are compensatory, pursuit, precognitive, and preview. In a compensatory task only the system error is displayed or presented to the pilot. Precognitive task is one where the pilot experiences a pure open loop programmed control-like situation. One example is that the
overall input to the system is a sinusoidal, which is very quickly learned by the pilot who operates in precognitive mode.
10.3.1 Motion Plus Visual and Only Visual Cue Experiments
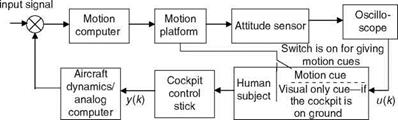
In manual control experiments with compensatory tracking tasks in a motion-based flight research simulator, a human operator’s control-theoretic mathematical models were obtained. The simulator facility had three degrees of freedom: pitch, roll, and heave motion [3,4]. The input-output data were generated while the operator performed a manual control task (Figure 10.2). Input to the pilot was in the form of a visual sensory stimulus as derived from the horizontal line on an oscilloscope, which represented a tracking error. The actual input signal was taken from the electrical signal equivalent to the display device. The tracking input was a band – limited random signal common to both the experiments. The output signal was derived from the movement of the stick used by the operator in performing the task. The idea was that first the operator performs the task while he or she is in the cockpit which was mounted on the moving base platform of the simulator. The tracking error was presented to the operator and he or she had to continuously try to keep the error at minimum. When the operator’s performance had reached a steady state, the data were recorded and subsequently sampled at 20 samples/s. The performance criterion was the integrated square error for the duration of the task. The human operator as a subject had to perform the same task repeatedly to reach his or her steady-state performance in terms of this criterion. Subsequently, for the same task the cockpit was unfastened from the moving base and placed on the ground and only visual cue was made available to the operator. However, since the motion platform will still be in action, its dynamics are common to both the experiments. Time-series/transfer function (TF) modeling was carried out for two such human operators while they independently tracked two types of dynamics simulated on an analog computer. Various model selection criteria were used and third-/fourth – order least squares (LS) time-series models in discrete-time domain (i. e., pulse TFs, 600 data points were used) were found adequate. Then, Bode diagrams were obtained from these pulse TFs and further analysis and interpretations were carried out. A human
|
Random
|
operator’s mathematical model (in the control-theoretic sense) in such a task can be defined by the LS model structure (Chapter 9):
A(q-l)y(k) = B(q-1)u(k) + e(k) (10.1)
As can be seen from Equation 10.1, the operator’s response naturally gets separated into the numerator and denominator contributions as [3]
![]() Hsp( jv) = B(jV)
Hsp( jv) = B(jV)
HEN( jv) = 1/A( jv)
Here, Hsp, the numerator part, is correlated to the human sensory and prediction part, and the denominator HEN to the equalizing and the neuromuscular parts. A visual input is considered a relatively unpredictable task, and if the motion cue is added, in addition to the visual cues, it will elicit the lead response from the operator. This would show up in the sensory and prediction part, Hsp. The phase improvement, or phase ‘‘lead,’’ generated by the operator during the congruent motion cues over the visual cues, can be attributed to the functioning of the ‘‘predictor operator’’ in the human pilot. Thus, a simple LS time-series model can be obtained to isolate the contributions of motion cues and any other cues from body sensors to have a better understanding of human operators’ behavior in manual control tracking tasks.
Example 10.1
From the experiments just described the shift form transfer function (SFTF) were obtained for two subjects (human operators) from the time-series data using the LS model. These transfer function (TF) were converted to continuous time transfer function (CTTF) using the complex curve fitting approach [3]. One pair of these TFs (human operator’s model) is given for a subject who performed the manual control tracking task with motion and visual cues and only visual cues:
Obtain the Bode diagrams of these control-theoretic human operator’s models.
Solution
The TFs are put into simple and standard forms for use in the MATLAB program:
Then, we have nummv = [52.05 185.82]; denmv = [1 15.08 169]; bode(nummv, denmv); hold; numv = [14.398 60.035]; denv = [1 8.22 83.36]; bode(numv, denv). This will obtain the Bode plots for both the CTTFs (Figure 10.3). We observe that
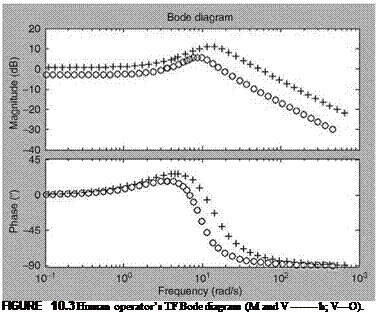 |
there is some phase lead due to the presence of the motion cue. We can see that the motion cue elicits the lead response in the human operator. The motion cue is considered as congruent because it aids the piloting task.
Well-known human operator/controller models are [1,5] (1) the crossover model and (2) the optimal control model. These models are valid under the following conditions:
(1) the forcing function is a random input signal, (2) aircraft dynamics are assumed to be linear, (3) human operators are fully attentive to the compensatory tracking task. A human operator even from control-theoretic point of view is a nonlinear complex dynamic system. However, a reasonably good approximation can be made by using quasilinearization, looking for an adequate linear correlation between input stimulus and output responses, i. e., neuromuscular. Using this approach the controller behavior of the human pilot can be represented by (1) a random input quasilinear describing function and
(2) a remnant, the pilot output that is not linearly correlated with the input.
A general higher-order (HO) model would be
It is found that, in general, the HO’s frequency response closely resembles an acceptable feedback control system. The crossover model [5] is also very useful and popular:
This is a combined model of the controlled plant and the HO model. In the crossover region the popular model is 1 vce—st, where the crsossover frequency is 4.7 rad/s for an
integrator plant and 3.25 rad/s for K/s2 plant and the effective time delay is 0.18 and 0.33 for respective aircraft dynamics. Thus, the HO uses the simplified adaptation rule: equalization such that the PAS open loop transfer (describing) function is much greater than 1.0 at low frequencies with a —20 dB/decade slope in the region of crossover frequency. This crossover frequency ranges from 3 to 8 rad/s. Intuitively, the crossover model satisfies the open loop control system TF: large magnitude at low frequency and small gain at high frequency, and also large phase margin at the crossover frequency.