
Our heavyweight helicopter equal in the world does not have
In Rostov started production of the most load-lifting rotary-wing car The Russian holding «Helicopt[...]

Everything about aircrafts and helicopters. News and events in aviation worldwide. Civil, transportation, military helicopters and airplanes.

Everything about aircrafts and helicopters. News and events in aviation worldwide. Civil, transportation, military helicopters and airplanes.

Everything about aircrafts and helicopters. News and events in aviation worldwide. Civil, transportation, military helicopters and airplanes.

Everything about aircrafts and helicopters. News and events in aviation worldwide. Civil, transportation, military helicopters and airplanes.


Optical methods allow the detection of density variations that occur in a fluid due to changes in temperature and/or speed and/or composition. The principle on which these methods are based is that the variation of density, p, produces a variation of the refractive index, n, of the fluid which in turn influences the trajectory (refraction) and the phase of the light rays that pass through the fluid. Appropriate optical devices convert the resulting effect in changes of light intensity on a screen or on a photograph.
The index of refraction, n, of a transparent medium, which is the ratio between the speed of light in vacuum and the speed of light in the substance, is related to the density by the Lorenz-Lorentz equation:
where R (l) is, for each substance, a function of the wavelength, l of the light.
When the index of refraction n = 1, as in the case of gases (see Table 6.1), Equation (6.1) can be expanded in series and, stopping the
|
Substance |
Index of Refraction, n [-] (Sodium D line) |
|
Quartz |
1.45843 |
|
Gelatin |
1.516-1.534 |
|
Canada balsam |
1.53 |
|
Crown Glass |
1.517 |
|
Flint Glass |
1.575-1.89 |
|
Water (15°C) |
1.33377 |
|
Air (0°C, 760 mm Hg) |
1.0002926 |
|
Carbon dioxide |
1.000448-1.000454 |
|
Helium |
1.00036-1.00036 |
|
Nitrogen |
1.000296-1.000298 |
|
Water vapor |
1.00249 |
|
Table 6.1 |
|
Refractive index of some substances |
series at the first two terms, the simpler Gladstone-Dale equation is obtained:
n = 1 + K(X) p = 1 + ^( ) p (6.2)
Ps
where K(l) = 1.5 R(l) and ps is the density at standard conditions (T = 0°C, p = 760 mmHg).
The values of P for some gases are reported in Table 6.2.
Changes in the Gladstone-Dale constant with the wavelength are limited to a few percentages (see Table 6.3).
|
Gas |
P.104 |
|
Air |
2.92 |
|
Carbon dioxide |
4.51 |
|
Nitrogen |
2.97 |
|
Helium |
0.36 |
|
Oxygen |
2.71 |
|
Water vapor |
2:54 |
|
Table 6.2 |
|
Values of constant P for l = 589.3 nm |
|
Wavelength l nm |
Gladstone-Dale constant K.103 m3kg_1 |
|
262.0 |
0.2426 |
|
296.0 |
0.2380 |
|
334.0 |
0.2348 |
|
436.0 |
0.2297 |
|
470.0 |
0.2287 |
|
479.8 |
0.2284 |
|
489.0 |
0.2281 |
|
505.0 |
0.2276 |
|
510.0 |
0.2276 |
|
521.0 |
0.2272 |
|
546.0 |
0.2269 |
|
578.0 |
0.2265 |
|
579.0 |
0.2263 |
|
614.7 |
0.2261 |
|
644.0 |
0.2258 |
|
Table 6.3 |
|
Gladstone-Dale constant for air |
![]()
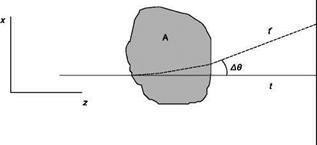 |
Effects of a change of refractive index on a light ray
Assume that the fluid is confined in a region of space and that the region is crossed by a beam of parallel rays of monochromatic light that propagate along the axis z. A generic ray (Figure 6.14), in the absence of disturbance, i. e. the properties of the fluid are uniform in the region, reaches the screen at the point P at time t; if the fluid properties are not uniform, the trajectory of the ray deviates of an angle A© from the straight line due to the phenomenon of refraction and the ray reaches the screen at the point P’ at the time t’ Since a change in density is related to a change in refractive index, and thus to the speed of light in the medium, the various rays reach the screen at different times. Appropriate optical systems highlight separately, by variations in the brightness of the image, the displacement PP’ (shadowgraph) or the deflection A© (Schlieren method) or the phase delay At (interferometric methods).
We will show below that the shadowgraph method is sensitive to the gradients of the gradients of density, the Schlieren method and the differential interferometer visualize the values of density gradients, and the separated beam interferometer measures the difference Ap between the local density and a reference density. It is then obvious that an interferogram obtained with a separated beam interferometer lends itself to a quantitative analysis of the density field much better than a shadowgraph that requires a double integration resulting in heavy approximation errors.
