Our heavyweight helicopter equal in the world does not have
In Rostov started production of the most load-lifting rotary-wing car The Russian holding «Helicopt[...]

Everything about aircrafts and helicopters. News and events in aviation worldwide. Civil, transportation, military helicopters and airplanes.

Everything about aircrafts and helicopters. News and events in aviation worldwide. Civil, transportation, military helicopters and airplanes.

Everything about aircrafts and helicopters. News and events in aviation worldwide. Civil, transportation, military helicopters and airplanes.

Everything about aircrafts and helicopters. News and events in aviation worldwide. Civil, transportation, military helicopters and airplanes.


When the properties of a material are the same in all directions, the material is called isotropic. Aono et al. [506] reported on a combined computational and experimental study of a well-characterized flapping wing structure. An aluminum wing was prescribed with single degree-of-freedom flapping at 10 Hz and ±21° amplitude. Flow velocities and deformation were measured using digital image correlation and digital PIV techniques, respectively. In the most flexible flapping wing case, the elastic twisting of the wing produces substantially larger mean and instantaneous thrust due to shape-deformation-induced changes in effective AoA. Relevant fluid physics were documented including the counter-rotating vortices at the leading and the trailing edge, which interact with the tip vortex during the wing motion.
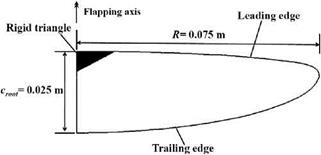
In this section we focus on a 3D hovering flapping isotropic wing in air. The wing is a flat plate wing of cm = 0.0196 m and AR = 3.825, with a thickness ratio of h* = 2.0 x 10⁻² having a Zimmerman planform (see Fig. 4.37, hovering in air at
![]()
|
Re = 1.5 x 10³. A sinusoidal flapping motion is introduced at the rigid triangle at the leading edge at the wing root following Eq. (3-15) with St = 0.25 and к = 0.56. The flapping axis is parallel to the wing root. Note that in the axes definition by Wu et al. [507] the wing flaps up and down to generate thrust due to wing flexibility; however, in the study considered here, the flapping wing axis has been rotated so that the flapping axis is parallel to the lift direction, such that any flexibility in the wing leads to lift generation. The triangular rigid region near the root at the leading edge undergoes prescribed motion and is constrained in all degrees of freedom in the structural solver, since the flapping mechanism in the experiment [506] is actuated at this region on the wing.
To assess the effects of wing properties – the effective stiffness П and the density ratio p* – on the resulting lift and wing deformations, surrogate models are constructed to qualitatively explore their implications. The range for these variables in the design space is chosen to cover a wide range of applications, as shown in Figure 4.38. To effectively assess the order of magnitude of the design variables, a logarithmic scaled design space is populated.
The objective functions are (i) the lift coefficient averaged over one motion cycle between the second and the third cycle and (ii) the twist angle в given as
в = max{acos(c3 ■ el)}, (4-28)
where c3 is the unit vector in the direction from the leading edge to the trailing edge at near the mid-span of the wing and et is the unit vector in the lift direction.
![]()
![]()
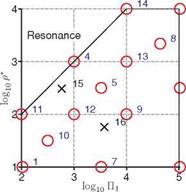 Figure 4.38. Design of experiment in logarithmic scale for the design variables П1 and p*. The training points are indicated by circles and the training points by crosses.
Figure 4.39. Surrogate model responses for (a) lift, (b) twist, and (c) bending angles for a flapping isotropic Zimmerman wing, hovering at Re = 1.5 x 10³ and k = 0.56.
So в gives the degree of the lift-favorable projectional area of the wing due to the deformation, and (iii) the bending angle f that is defined as
![]()
![]()
 |
 |
 |
||
– ф
which measures the wing deformation in the spanwise direction x as the maximum tip displacement angle relative to the imposed flap angle ф. For simplicity we refer to lift as the time-averaged lift coefficient in this section.
The experiments use a face-centered cubic design (FCCD). Then the remainder of the design space is filled evenly in the design space, with the cases 8 and 10 together with the testing points generated by the latin hypercube algorithm. In total 14 training points are selected. The design space with a logarithmic bias toward the softer П1 and lighter p* structures is shown in Figure 4.38. The region where log10 p* > log10 П1 + 2 is out of the scope of the current study as this region showed largely unstable behavior of the wing motion because the imposed frequency of 10 Hz is close to the natural frequencies [351].
The resulting surrogate models are shown in Figure 4.39 for the lift, twist, and bending angle. Notice that the time-averaged lift for the rigid wing would be zero due to the symmetry in the hovering kinematics without pitching motion. The lift, twist, and bending are at the maximum at case 4 (shown in Fig. 4.38). However, these three objective functions follow qualitatively similar trends in the design space, suggesting that there exists a correlation between the resulting time-averaged lift force and the maximum deformations. Furthermore, it is not only the effective stiffness П1 or the density ratio p* but also the balance between these two parameters that determine the resulting deformation and the lift generation. The region of increased objective functions between log10 П1 = 4 and 5 and log10 p* = 1 to 2 is caused by the error in the surrogate model due to the high gradient near the resonance region, yet there is a wide region of almost zero values at the stiffer and lighter portion of the design space.
As the sinusoidal rigid-body motion is imposed at the triangular rigid part near the wing root (see Fig. 4.37), the wing inertia and the resulting aerodynamic load are balanced out by the elastic force. Since the wing is made of isotropic material the structure responds with both spanwise bending and twisting.
For the chordwise flexible airfoil in Section 4.4.2.1 and the spanwise flexible wing in Section 4.4.2.2, the thrust generation in forward flight was shown to be mostly dependent on the resulting tip motion relative to the imposed kinematics at the wing root. For the flapping Zimmerman wing in hover in air, maximum horizontal tip displacement w, normalized by the prescribed amplitude ha = R sin фa, is plotted against the phase lag with respect to the top of the stroke of the rigid body motion. The higher tip amplitude corresponds with the larger phase lag compared to the imposed kinematics, while the tip motion is in phase. The cases with the lowest П1/р* ratio have larger deformation consistent with the surrogate model responses shown in Figure 4.39.