NACA Four-Digit Airfoils
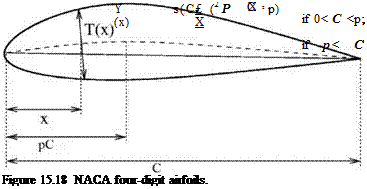
A very famous series of airfoil shapes is the NACA four-digit airfoils. These airfoils are completely defined by four parameters:
C the length of the chord line; є the maximum camber ratio;
p the chordwise position of the maximum camber ratio; t the thickness ratio (maximum thickness/chord).
If x is the distance along the chord, the thickness distribution is
 |
|
and the camber line (see Figure 15.18) is given by two parabolas joined at the maximum camber point as follows:
The first of the airfoil’s four-digit designation is 100e, the second digit is 10p, and the last two are 100т.
 |
|
The upper part of the airfoil is given by
Theoretically, one may have airfoils with sharp trailing edges. In reality, a sharp trailing edge is nearly impossible to make. Practical airfoils invariably have a blunt or slightly blunt trailing edge. A simple way to incorporate a blunt trailing edge to an airfoil is to replace the sharp tip by a semicircular arc as shown in Figure 15.19.
Figure 15.19. Blunt trailing edge of an airfoil.
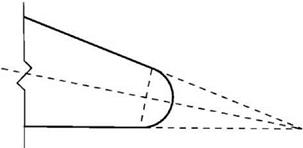
Analytically, for x > qc (q is the chordwise position of the circular arc), a blunt trailing edge airfoil has a thickness T and a camber line Y as follows:
Y(x) = Y'(qC)(x – qC) + Y(qC) (15.39)
However, the airfoil is slightly shortened. The new chord length is given by
C* = qC + r. (15.40)
2[1 + (Y’ (qC ))2]2
15.3 Example I: Direct Numerical Simulation of the Generation of Airfoil Tones at Moderate Reynolds Number
It is known experimentally that an airfoil immersed in a uniform stream at moderate Reynolds number would emit tones. This phenomenon has been studied by a number of investigators. Surprisingly, there are significant differences in their experimental results. Furthermore, there is no clear consensus on the tone generation mechanism. There are two objectives in including this problem in this chapter. The first objective is to demonstrate how to develop a CAA code. The second objective is to illustrate how direct numerical simulation can assist in resolving or clarifying experimental disagreement. In addition, numerical simulation provides a full set of space-time data (not always available from an experiment), which may be used to investigate the many details of the phenomenon so as to shed light on the underlying tone generation mechanism. It is said that numerical simulation is used most often for prediction. However, the most useful contribution of numerical simulation is to provide a better understanding of the physics and mechanisms of a phenomenon under consideration.
Paterson et al. (1972) were the first to report the observation of tone generation associated with uniform flow past a NACA0012 airfoil at moderate Reynolds number. Figure 15.20 represents the principal result of their work. In this figure, the frequencies of the tones detected are plotted as a function of flow velocity. The ladder structure of the data was quickly recognized (Tam, 1974) as an indication that the observed tones were related to a feedback loop. A feedback loop must satisfy
Figure 15.20. Tone frequency versus flow velocity measured by Paterson et al.
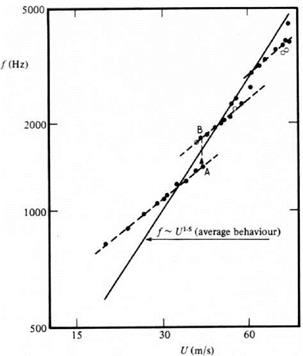 certain integral wave number requirements. The ladder structure is a consequence of a change in the quantization number of the feedback loop. At certain flow velocities, two tones were measured simultaneously. As velocity increases, the dominant tone frequency jumps to the next ladder step as indicated by A to B in Figure 15.20. This is usually referred to as staging. Further velocity increase causes the subdominant tone to vanish. By carefully analyzing their data, Paterson et al. found that the dominant tone followed a U15 power law (see Figure 15.20) where U is the free stream velocity. Based on their extensive measurements, they proposed the following formula for the dominant frequency, f:
![]() 0.011U15
0.011U15
1
(vC)2
where C is the chord width and v is the kinematic viscosity. Eq. (15.41) is referred to as the Paterson formula.
Arbey and Bataille (1983) repeated the airfoil experiment in an open wind tunnel as Paterson et al. did. In all their experiments, the airfoil was at a zero degree angle of attack. Just as Paterson et al. they observed tones. In fact, there is a multitude of them. Figure 15.21 shows a typical spectrum of their measurements. The tones are separated by about 110 Hz. Arbey and Bataille discovered that the frequency of the dominant tone (fs in the center of the spectrum of Figure 15.21) was in good agreement with the Paterson formula (see Figure 15.22). However, there are distinct differences between the two experiments. First of all, Arbey and Bataille measured many tones, but Paterson et al. had at most two tones simultaneously. Moreover, the frequencies of the two tones in the Paterson et al. experiment are separated by a
Figure 15.21. The spectrum of airfoil tones measured by Arbey and Bataille.
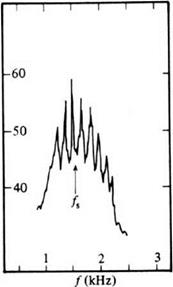 magnitude of about five times that of the tones of Arbey and Bataille. When plotted in a frequency versus velocity diagram, the tones of Arbey and Bataille also form a ladder structure suggesting again that the tones are related to a feedback loop.
Unlike Paterson et al. and Arbey and Bataille, Nash, Lowson, and McAlpine (1999) performed their airfoil experiment inside a wind tunnel. They quickly realized that the cross-duct modes and the Parker modes of the wind tunnel could interfere with the airfoil tone phenomenon. To eliminate this possibility, they lined the wind
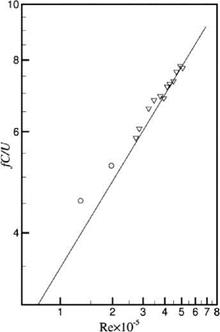 Figure 15.22. Strouhal number of dominant airfoil tone versus Reynolds number measured by Arbey and Bataille. Straight line is the Paterson formula.
|
Figure 15.23. Airfoil tones measured by Nash et al. Straight line is the Paterson formula. |
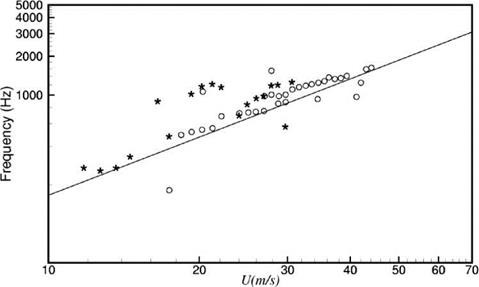
tunnel walls with sound-absorbing materials. Under such an experimental condition, they found that, for each free stream velocity, there was a single tone and no ladder structure. They suggested that the ladder structure data of Paterson et al. and Arbey and Bataille were influenced by their experimental facilities. The feedback and ladder structure of the data were not characteristics of the airfoil tone phenomenon. The feedback loop apparently was locked on something in the experimental facility outside the open wind tunnel. At a low angle of attack, the tone frequency-flow velocity relation measured by Nash et al. is also in good agreement with the Paterson formula (see Figure 15.23). At a high angle of attack, because of the blockage of the wind tunnel by the model, the measured relationship deviates from the Paterson formula, as would be expected.
It should be clear at this time that there is little agreement among the most prominent airfoil experiments reported in the literature. One major issue is whether the basic tone generation mechanism is related to a feedback loop, which would generate multiple tones or, as in the observations of Nash et al., feedback is spurious and there should only be a single tone. Even among investigators who observed multiple feedback tones, the details of the observed phenomenon are quite different. Therefore, it is fair to say that, up to the present time, no two experiments have the same results. The only agreement of all the major experiments is that the Paterson formula is a good prediction formula for the dominant tone frequency. This is true over a wide range of Reynolds numbers.
One way to resolve the disagreement is to perform highly accurate numerical simulations of the phenomenon. Numerical simulation has a number of advantages. First of all, when properly carried out, it can avoid facility-related feedback. Another advantage is that there is no background wind tunnel noise inherent in an experiment. It is no exaggeration to say that numerical simulation is, perhaps, the simplest way to reproduce the tones of a truly isolated airfoil. Finally, numerical simulation provides
a full set of space-time data of the flow and acoustic fields that would facilitate the investigation of the tone generation mechanisms.


