Energy Source of Airfoil Tones
A number of investigators, e. g., Tam (1974), Fink (1975), Arbey and Bataille (1983), Lowson et al. (1994), Nash et al. (1999), Desquesnes et al, (2007), Sandberg et al. (2007), Chong and Joseph (2009), and Kingan and Pearse (2009), have suggested that airfoil tones are driven by the instabilities of the boundary layer. Various computations of Tollmien-Schlichting-type instabilities have been performed. The objective is to show that the frequency of the airfoil tone is the same as that of the most amplified instability wave. An examination of the past computation reveals that the spatial growth rate of the Tollmien-Schlichting wave is very small. Only in the separated flow region is there a substantial growth rate. However, all the instability calculations were carried out using the locally parallel flow approximation. Unlike attached boundary layers, the thickness of a separated boundary layer increases rapidly. This makes the appropriateness of the parallel flow approximation questionable. Thus, one should not be too ready to accept the results of past instability calculations without an examination of the approximation adopted in the computation.
In the present study, the NACA0012 airfoil is set at zero degree angle of attack on purpose. At a zero degree angle of attack, there is practically no flow separation on the airfoil until almost the trailing edge. Thus, the spatial growth rate of the Tollmien – Schlichting wave is much smaller than that of the Kelvin-Helmholtz instability in the wake of the airfoil. It is known that the growth rate of Kelvin-Helmholtz instability is inversely proportional to the half-width of the shear layer. In other words, a thin wake is more unstable than a thicker wake. That this is true is shown in Figure 15.40. This figure shows the computed spatial growth rate (antisymmetric mode) over the distance of a chord for Airfoil #1 at different instability wave frequencies. The computations are done using the nonparallel flow instability theory of Saric and
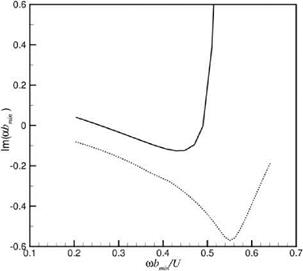
Figure 15.41. Comparison between the spatial growth rates of Kelvin-Helmholtz instability waves at the minimum halfwidth point using locally parallel (………………………………. )
 and nonparallel (—– ) instability theo
ries. Airfoil #2, Re = 3 x10⁵.
Nayfeh (1975). The flow in the calculation has a Reynolds number of 3 x 10⁵. The solid curve is for the minimum half-width point of the wake at x/C = 1.088 measured from the leading edge of the airfoil. The dotted curve is for a point in the developed wake region (x/C = 1.556). The maximum growth rate at the thinnest point of the wake is many times larger than that in the developed wake.
By performing instability computation, it is easy to establish that the maximum growth rate occurs in the wake at the location where the wake half-width is minimum. It is believed that because the growth rate is very large, the instability initiated at this region is ultimately responsible for the generation of airfoil tones. The necessary computed instability results to support this hypothesis will now be provided. Because of the rapid growth of the thickness of the wake at the minimum half-width location, Tam and Ju (2012) recognized that the nonparallel flow instability wave theory of Saric and Nayfeh (1975) should be used to perform all instability computations. Their method is a perturbation method. The zeroth order is the locally parallel flow solution. A first-order correction, to account for the spreading of the mean flow, is then computed. The combined growth rate is taken as the nonparallel spatial growth rate. Figure 15.41 shows the difference between parallel and nonparallel spatial growth rates at the minimum wake half-width point for Airfoil #2 at a Reynolds number of 3 x 10⁵. It is straightforward to see from this figure that the nonparallel flow growth rate is smaller. Furthermore, the frequencies of the most amplified wave computed using parallel and nonparallel flow theories are quite different.
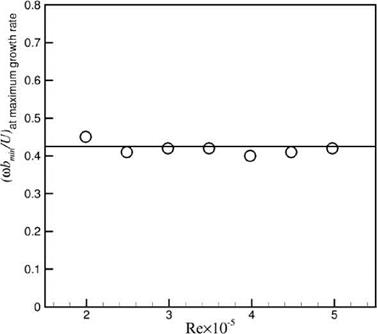
Figure 15.42 shows the angular frequency of the Kelvin-Helmholtz instability wave with the highest amplification rate at the narrowest point of the wake of Airfoil #2 as a function of Reynolds number. When nondimensionalized by minimum halfwidth bmin and free stream velocity U, the quantity (<& bmin/U) at the maximum growth rate is nearly independent of the Reynolds number. A good fit to the data is as follows”
![]()
«4.3. (Airfoil #2). (15.61)
Now, for this airfoil, bmin and Reynolds number are related by Eq. (15.56). By eliminating bmin from Eq. (15.56) and Eq. (15.61), it is found that
![]()

0.00835U15 1
(Cu)2
Eq. (15.62) is exactly the same as Eq. (15.59) for Airfoil #2. The K value obtained directly from numerical simulations, displayed in Table 15.3, is in agreement with that from hydrodynamic instability consideration.
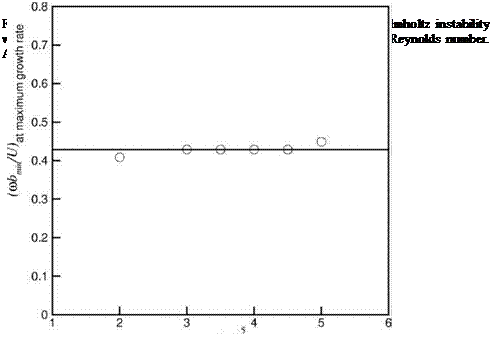
A similar nonparallel instability analysis for Airfoil #1 has also been carried out. Figure 15.43 shows the angular frequencies corresponding to that at maximum growth rate nondimensionalized by bmin and U as a function of the Reynolds number. An approximate relationship similar to Eq. (15.61) is
Thus, by eliminating bmin from Eqs. (15.57) and (15.63), a tone frequency formula based on wake instability consideration for this airfoil is
![]() 0.00910U15 1
0.00910U15 1
(Cu)2
The proportionality constant in Eq. (15.64) differs slightly from that found from direct numerical simulation as given in Table 5.3. Figure 15.44 shows a direct comparison between the tone frequencies measured directly from numerical simulations
|
Figure 15.43. The angular frequency of the most amplified Kelvin-Helmholtz instability wave at the minimum half-width point of the wake as a function of Reynolds number. Airfoil #1. |
(triangles) and the most unstable frequencies in the wake at minimum half-width (straight line). The agreement is quite good. It is, therefore, believed that the good agreements for Airfoils #1 and #2 lend support to the validity of the proposition that the energy source of airfoil tones at zero degree angle of attack is near wake flow instability.


