Flow Field
At zero degree angle of attack, the computed boundary layer flow on the airfoil remains attached almost to the trailing edge. The boundary layer flow is steady while the flow in the wake is oscillatory. Figure 15.31 shows a plot of the computed instantaneous vorticity field around Airfoil #2 at a Reynolds number of 2 x 10⁵.
The leading edge of the airfoil is placed at x = 0. This is typical of all the cases investigated. The flow leaves the trailing edge of the airfoil smoothly. There is no vortex shedding at the trailing edge, regardless of previous speculation (Paterson et al., 1973). The oscillations in the wake intensify in the downstream direction until it rolls up to form discrete vortices further downstream.
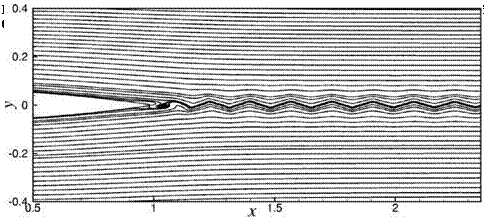
Figure 15.32 shows an instantaneous streamline pattern of the wake of Airfoil #2 at a Reynolds number of 4 x 10⁵. The wake oscillation is prominent in this figure. The wavelengths of the oscillations appear to be fairly regular. This suggests that there is flow instability in the wake.
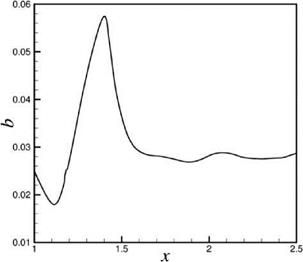
The mean velocity deficit profile in the wake resembles a Gaussian function. The half-width of the wake, b, near the airfoil trailing edge undergoes large variation in the flow direction. Figure 15.33 shows the variation of the half-width as a function of downstream distance for Airfoil #2 at a Reynolds number of 2 x 10⁵. The width of the wake begins to shrink right downstream of the airfoil trailing edge until a

 |
Figure 15.33. Spatial distribution of the half-width of the wake for Airfoil #2 at Re = 2 x 10⁵.
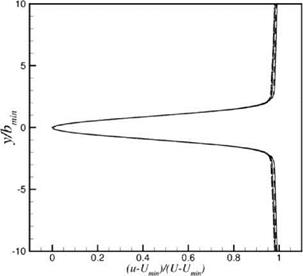
Figure 15.34. Similarity of velocity deficit profile at b = bmin in the wake of Airfoil #2. Reynolds number varies from 2 x 10⁵ to 5 x 10⁵ at 0.5 x 10⁵ interval.
 minimum is reached at b = bmin. It grows rapidly further downstream, reaching a maximum before decreasing and attaining a nearly asymptotic value.
The velocity deficit profiles of the wake exhibits self-similarity. Figure 15.34 shows a collapse of the velocity profiles at minimum half-width over a large range of Reynolds numbers. In this figure, the variable (u – Umin)/(U – Umin) is plotted against y/bmin, where Umin is the minimum velocity of the mean flow profile and b is the half-width. In Figure 15.34, data from Reynolds number of 2 x 10⁵ to 5 x 10⁵ at 0.5 x 10⁵ intervals are included. There is a nearly perfect match of the set of seven profiles.
The similarity property of the wake velocity profiles suggests the possibility of the existence of a simple correlation of the minimum half-width of the wake with flow Reynolds number (Re). Figure 15.35 shows a plot of (bmin/C)Re1/2 against Re (C is the chord width) for Airfoil #2. It is seen that the measured values of this quantity from the numerical simulations are nearly independent of Reynolds number over the entire range of Reynolds number of the present study. Thus, the minimum halfwidth of the wake, bmin, of Airfoil #2 has the following form of Reynolds number dependence:
A similar analysis has been performed for Airfoil #1. Figure 15.36 shows that the quantity (bmin/C)Re1/2 again is approximately a constant. In this case, the value bmin and Reynolds number are related by,
b 1
-^Re^ «7.45. (Airfoil #1). (15.57)


