The “Voice of the Dragon”
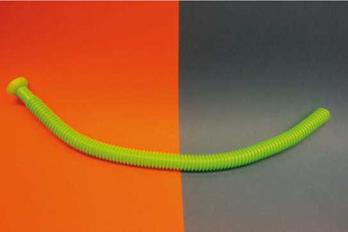
Corrugated pipes (Figure 23) are locally rigid and globally flexible. This makes them very useful for many applications ranging from vacuum cleaner tubes to risers for offshore natural gas production. A problem is, however, that flow through such pipe can cause severe whistling. Actually, a plastic
|
Figure 23. Corrugated pipe used as musical toy. |
corrugated pipe of a length of L = 80 cm and an inner diameter D = 3 cm is commonly used as a musical toy called: hummer [Silverman and Cushman (1989)]. In musical applications this toy is called: the ”Voice of the Dragon” [Silverman and Cushman (1989)]. Holding one open end of the tube in the hand and swirling the tube above the head produces a melodic sound with increasing pitch as the angular rotation velocity Q increases. This tube is actually a centrifugal pump. Due to centrifugal acceleration Q2r there is a pressure gradient dp/dr = —p0Q2r along the tube, where r is the distance from the (non moving) open end. At the moving open end of the tube the outflow forms a free jet due to viscous flow separation. This free jet implies that the pressure at this open end is close to the atmospheric pressure po. Hence the pressure at the opposite (non moving) open end is p(0) = p0 — 1 p0Q2L2. In the inflow from the surrounding to the fixed inlet, we can apply the Bernoulli equation p(0) + 2p0U2 = p0 from which we conclude that in first order approximation U = QL [Nakiboglu et al. (2012)].
The flow along the corrugations can be seen as a grazing flow along a shallow cavity. The cavity depth H is so small (order of a few millimetres) that we can in first approximation neglect the compressibility of the air in the cavity. The shear layer formed along the opening of the cavity is unstable. The whistling is caused by coupling this instability to a longitudinal acoustic wave along the pipe. The acoustic modes of the pipe have frequencies predicted by fn = n(ceff /2L) (n = 1, 2, 3) where the effective speed of sound along the pipe is:
c‘"=с°Ш (196)
Were Vin = nD2L/4 is the inner volume excluding the cavities of the corrugations and Vtot is the total volume of the tube including the cavities.
The critical Strouhal number SrW = f (W + rup) for whistling based on the cavity width W plus the upstream edge radius of the cavities rup appears to be a function of W/D. As shown in figure 25 SrW varies from
|
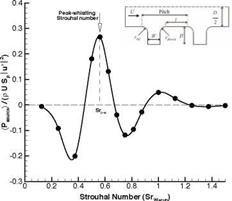
Figure 24. Sound power produced by a cavity in a corrugated tube as a function of the Strouhal number [Nakiboglu et al. (2011)]. |
0.8 to 0.3 as W/D varies from 1 to 0.05. In an attempt to explain this variation Nakiboglu et al. (2011) considered incompressible 2-D axial symmetric flow simulations of a single cavity along a tube. These simulations have been carried out with a commercial code. In the model Nakiboglu et al. (2011) imposes, at a distance D/2 upstream of the cavity, a steady flow profile corresponding to the time average of the fully developed turbulent flow profile through a corrugated pipe. This can be calculated by using a steady RANS (Reynolds Average Navier Stokes) calculation or it can be measured. A harmonically oscillating uniform (over the cross section) velocity representing the acoustic plane wave is superposed on this time average profile. The fluctuation in the difference in total enthalpy AB’ over the cavity is calculated. The difference of total enthalpy AB’ref calculated for the same boundary conditions across a reference straight tube segment is
subtracted AB’ — AB’ref. The acoustic power generated by the cavity is then calculated by using vortex sound theory:
< P >=< po(AB’ — AB’ref )u’ > . (197)
Figure 24 shows the results obtained for this acoustic power at fixed am-
plitude u’/U as a function of Srw = f (W + rup)/U. The maximum of the predicted power is assumed to correspond to the critical whistling Strouhal number (Figure 25). As explained by Nakiboglu et al. (2011) the decrease of SrW with increasing D/(W + rup) is acually due to the change in ratio of boundary layer thickness and cavity width. The same effect has been reported by Golliard (2002), Kooijman et al. (2008) and Ma Ruolong et al. (2009).
We observe an almost perfect agreement between theory and experiments (Figure 25). The prediction of the whistling amplitude using this model appears to be less successful [Nakiboglu et al. (2011)]. The model overestimates the source power by about a factor of two.
Another interesting fact is that a laminar model was used to predict the dynamic response of a turbulent flow to acoustic forcing. This approach has already been used in many papers such as the work of Michalke (1965) and Mery and Casalis (2008). However, we do provide at this point any explanations for the success of the quasi-laminar method. This calls for further research.
![]()


