Beam Model Test Setup
While these studies revealed first clues of the influence of the structural and CFD surface mesh spacings, the test configuration is very abstract and the conclusions
 |
 |
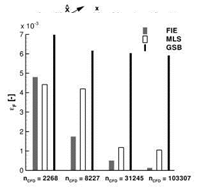
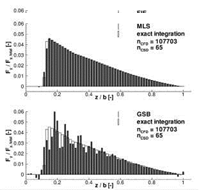
Fig. 7 Influence of the CFD mesh resolution on the structural load distribution. top left: Definition of the fictitious pressure field imposed on the wing. top right: Nodal forces in flap – wise direction resulting from the pressure distributions on the coarsest and the finest surface mesh and the projection with FIE. These loads are juxtaposed with those obtained by exact integration of the pressure distribution. bottom left: RMS error of the nodal forces in flap-wise direction for the three projection methods. bottom right: Nodal forces in flap-wise direction resulting from the pressure distributions on the finest surface mesh and projection with MLS and with GSB.
may not be transferable to real-world problems. Further test configurations were created for use together with the stand-alone version of the ACM which are based on the wetted surface of the HIRENASD wing [4]. The resolution of the wetted surface was varied again to quantify its effect on the structural load distribution. Four refinement levels with 2268, 8227, 31245 and 107703 nodes were realised by extracting different multigrid levels from a structured FLOWer mesh. Certainly, with an actual flow solver any change of the mesh alters the flow solution. Because this problem is specific to the single-field solver and not to the spatial coupling method, a fictitious pressure distribution was again employed here. It is defined in terms of the rotated planform coordinates (x, z) shown on the top left of Fig. 7. The z-axis is chosen to connect the quarter-chord points at root and tip. The pressure distribution describes a quarter cosine wave along the z-axis and half a sine wave along
 |
 |
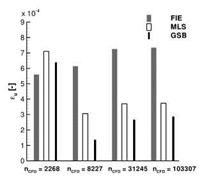
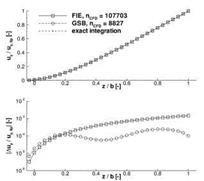
Fig. 8 Influence of the CFD mesh resolution on the structural deformation. left: RMS error of the flapwise bending deflections resulting from the different load distributions. right: Comparison of the actual bending deflections and the distributed error for the case with the highest deflection error (FIE, nCFD = 103307) and the lowest (GSB, nCFD = 8227).
 |
||||||
the perpendicular coordinate direction Jc. In the shaded areas the fictitious pressure distribution is zero. It is applied with opposite signs to both surfaces of the wing to produce a net positive bending moment in flap-wise direction. From the exact integration of the pressure distribution a line load along the z-axis is obtained. If a beam stick model has parallel orientation, the line load can be divided consistently among the structural nodes to obtain a reference load distribution. This serves to define an error incurred by each projection scheme in dependence of the surface mesh resolution. Moreover, with the reference load distribution the structural deformation is computed and compared to those of the projected loads. As a measure for the error the root mean square (RMS) of the nodal forces in flap-wise direction, normalised by the total force in flap-wise direction, is used:
This is plotted in the bottom left image of Fig. 7 and different trends are apparent for the projection schemes. FIE exhibits a strong reduction in the error when the surface mesh resolution is increased, whereas the error with GSB remains almost constant. MLS ranges in between. In contrast to the FIE method the MLS and GSB methods are not able to capture the discontinuous onset of the pressure distribution near the root because they rely on finite support radii. Even with the finest surface mesh the load distribution at the root remains smeared out. Over the remaining span the MLS method approximates the exact loads well, whereas with the GSB method there are still large discrepancies, as can be seen from the bottom right diagrams of Fig. 7. In the left image of Fig. 8 the resulting bending deflections in flap-wise directions are compared by means of the RMS differences of the nodal deflections normalised by the tip deflection
It should be noted that because of their different normalisation the error values eu and eF cannot be directly compared.
For the investigated straight beam model, the differences in the load distribution do not translate in large differences in deformations. This is documented in the right diagram by a comparison of the bending deflections and their deviations from the reference distribution for the cases with the highest and the lowest total deflection error. The deformed structural models are almost identical because in all projection methods the redistribution of the bending forces along the beam axis is compensated by offset moments.
As the structural model is straight and the configuration comprises only a single assembly, no interpolation parameters come into play with the FIE method (cf. Chap. 3.2). For both the MLS and the GSB method, eight edge midpoints were set as supports, with nFB = 5 additional support points each. The radius of the support points was chosen as rFB = 0.15m, which is approximately half the mean chord length. Quadratic polynomials were used for the global contribution to the interpolation function of the GSB method and for the local interpolation functions of the MLS method.


