Flexible Airfoil Flapping
The flexible wing flapping in oscillating airfoils provides aerodynamic benefits in terms of lift and thrust generation as well as providing inherently light structures (Heatcote and Gursul 2007). The real positive effect of the chordwise flexibility in forward flight is the prevention of the flow separation by means of reducing the effective angle of attack while changing the camber of the airfoil periodically. During plunge motion with large amplitudes, we can keep the effective angle of attack lower than the dynamic separation angle with flexible camber (Gulcat 2009a, b). If we assume a parabolic camber, whose amplitude changes periodically with za(x, t) = —a*cos mt x2/^2 for a thin airfoil as shown in Fig. 8.36, we can obtain the boundary layer edge velocity due to flexible camber as
|
Table 8.4 Thrust coefficients for different a* at Re = 104, h* = 0.6, and k = 1
|
If we give the plunging motion as h = — h*cos (ait), and the camber motion with 90° phase,
za(x, t) = —a(t)x2/b2, a(t) = a*cos(at + я/2), — b < x < b
this provides us with the effective angle of attack which is less than dynamic stall angle. Now, the effective angle of attack for the combined motion at the leading edge is determined as follows
ae = tan — [—(h + WaLE )/Um] (8.44)
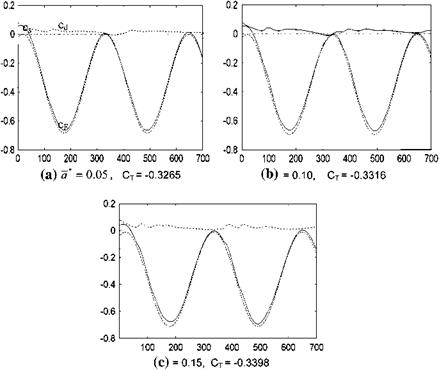
where WaLE is the downwash at the leading edge caused by the time dependent camber change. Shown in Fig. 8.37 is the time variation of the propulsive force coefficient plots obtained including viscous effects for the flexible airfoil at Re = 104 and k = 1 for three different camber ratios: (a) a* =0.05, (b) 0.1, and
(c) 0.15. The corresponding average force coefficients are found as a) CT = — 0.3265, (b) —0.3316, (c) —0.3398, respectively. The ideal average force coefficients and the computed values are compared in Table 8.4 at associated effective angles of attack, all less than the corresponding dynamic stall angle, which is 29°.
According to Table 8.4, tripling the camber ratio from 5 to 15% results in only a 4% increase in the average force coefficient, that is, from —0.3265 to —0.3398. This shows that increasing the camber ratio does not produce a significant overall propulsive force increase for the case of a flexibly cambered airfoil undergoing plunge.
The viscous drag acting on the parabolically cambered thin airfoil is also obtained using the boundary layer equations. Equations 8.2 and 8.5 give the inertial values of the velocity vector v = ui + vj and vorticty a, which is necessarily used in skin friction calculations, in moving deforming coordinates attached to the body as a non inertial frame (Gulcat 2009a, b) as shown in Fig. 8.38. Let x-y be the rectangular coordinates attached to the body, and let П-g be the curvilinear local coordinates with surface fitted П coordinate’s tangent angle with x axis being ab and let g be parallel to z axis. At a given point (x, y) this yields x = П cos a1, and y = xsina1 + g, wherein the continuity and the vorticity transport respectively reads as
1 Ou Ou Ov
tana1 + = 0
cosa1 on og og
|
|
|
![]() Ox u Ox Ox 1 o2x
Ox u Ox Ox 1 o2x
+ +(v _ u tan a1) = 2.
ot cosa1 on o g Re o g2
The discretized form of Eqs. 8.45, 8.46 for boundary layer solutions can be written in a way similar to those given in Appendix 10 except for new coefficients resulting from the scale factors expressed in terms of the surface angle a1.
So far, we have seen the aerodynamic benefits of the chordwise flexibility for the case of the periodic camber variation normal to the chord direction. Next, we are going to analyze the flexibility effects as the maximum camber location varying along the chord. Let the camber geometry of the thin airfoil be as shown in
 Fig. 8.38 Body fixed x-y coordinates, and body fitted П-g coordinates for a parabolically cambered thin airfoil
Fig. 8.38, and let the maximum camber location vary periodically with time. According to Fig. 8.38, the camberline equation for a piecewise parabolic variation with the maximum camber a located at p reads as
—a(x — p)2/(1 + p)2, x<p a(x — p)2/(1 — p)2; x
The time dependent downwash expression, w(x, t) = Oz/Ot + UOz/Ox with p = Op/Ot then becomes (Gulcat 2009a),
![]() 2ap (x — p)2/(1 + p)3 + 2a (x — p)(p — U )/(1 + p)2, x<p 2ap (x — p)2/(1 — p)3 + 2a (x — p)(p> — U)/(1 — p)2, x > p
2ap (x — p)2/(1 + p)3 + 2a (x — p)(p — U )/(1 + p)2, x<p 2ap (x — p)2/(1 — p)3 + 2a (x — p)(p> — U)/(1 — p)2, x > p
(8.48)
The full unsteady lift coefficient can be calculated for a simple harmonic motion using Eq. 3.32a. However, even if we assume that the periodic movement for the maximum camber location is simple harmonic, according to Eqs. 8.47 and 8.48, both the camber motion and the associated downwash are periodic but they are no longer simple harmonic. Therefore, we have to be cautious while using the formulae derived for unsteady force and moment coefficients. Nevertheless, for oscillations with small frequencies as a first approximation we can use the concept of steady aerodynamics, i. e. p = 0, the piecewise integration of Eq. 8.48 with Eq. 3.31a from —1 to p, and p to 1 gives the sectional lift coefficient as
For the maximum camber location at the midchord, i. e. p = 0, equation gives ci = 2ap as expected. The boundary layer edge velocity for the quasi steady case reads as
Є = 1 ± -= 1 ±— —— І8ІП(abs(p—x) 1 P( 1 — x2 ) ( 1 —p2 ) +1 — xp) /
U U p
[(1 — p)(1 + p)]2+^/y—x [(2(1+x)—2p)(p2+1)p+8(p2 — p(1+x))sin—(p) —SpP1 — p2 /[(1 —p)(1 +p)]2.
(8.50)
Here, + is used for upper and — is used for the lower surfaces of the airfoil. As expected, for p = 0 which means that the maximum camber at the mid-chord Eq. 8.50 gives
– = 2a ———— (1 + x)=2a VT~—x2". (8.51)
U 1 + x
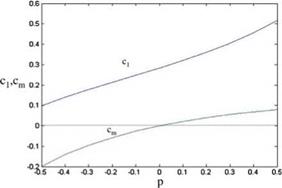
The steady sectional moment and lift coefficients obtained for an airfoil having 2% camber with its maximum camber location at p where -0.5 < p < 0.5 are given in Fig. 8.39. As observed in Fig. 8.39, the moment coefficient becomes positive for the p values which are of the mid-chord where lift coefficient increases significantly.
Shown in Fig. 8.40 is the steady surface velocity perturbation change with the location of the maximum camber. As expected, the peak value of the perturbation moves toward the mid-chord as the position of the maximum camber point moves the same way. Also shown in Fig. 8.40 is the surface velocity perturbation for a corrugated airfoil, bilinear in nature, with maximum camber location at quarter chord.
For non-negligible frequency values we have to consider p = 0, therefore, the downwash expression, w = w(t, x) must include the relevant terms known as quasi-steady aerodynamics, of expression Eq. 3.32a. The sectional lift coefficient then reads as
cqs = ai (sin-(p)/2-pJ 1-p2/2-(p2+2)sJ 1 – p2/3 + n/4)+bi (sin- (p)/
2-pJ 1 – p2/2 -J 1 – p2 + p/4) + C1 (sin – (p)-s/1 – p2 + p/2) +a2(-sin-(p)/2 + p/1 – p2/2+ (p2+2)sJ 1 – p2/3 + n/4) + b2(-sin-(p)/2 +p/1 – p2/2 + J 1 – p2 + p/4)+c2(-sin – (p) + /1 – p2 + p/2)
(8.52)
wherein,
a1 = 2ap/(1 + p)3, b1 =-2a1p + a1(1 + p)-2aU/(1 + p)2,
C1 = a1p2 – a1 (1 + p)p + 2aU/(1 + p)2 a2 = -2ap/(1 – p)3,
 |
b2 = -2a2p + a2(1 – p)-2aU/(1 – p)2, C2 = – a2p2 – a2(1 – p)p + 2aU/(1 – p)2.
Fig. 8.40 Surface velocity perturbation variation with maximum camber location
The edge velocity for the quasi steady aerodynamics reads as follows
|
|
j л/1 — x2ln 1 / (p — x)y/(1 — x2)(1 — p2 + 1 — px
— [c1 + b1 (1 + x)+A1 (1 + 2×2) /2] (sin —(p)+n/2) + [c1 + b1 (1 + x)+A1 (1 + 2×2) /2] (sin—(p)— p/2) + [(fl1 — a2)(p/2 — 2x)— b1 + b2W 1 — p2
(8.53)
The steady and the quasi steady aerodynamic approaches do not consider the effect of the wake as phase lag between the motion and the aerodynamic response such as lift or moment, and the reduction in their amplitudes. As we know, the measure of this lag and the amplitude reduction is the Theodorsen function C(k) = F(k) + iG(k). The amplitude of the lift coefficient for the quasi unsteady aerodynamics according to Eq. 3.32a reads as
cqu = C(k)cqs. (8.54)
The apparent mass term plays no role in quasi unsteady aerodynamics to give a simple relation between the vortex sheet strength and the lifting pressure, i. e. Ca = cpa/2. The boundary layer edge velocity then is found from the perturbation velocity: {u = ya/2}. The leading edge suction velocity P is given as
P = Jl^—A їа ‘ + ^
In expanded form it reads:
![]() | — (c1 + 1.5a1 )(sin p + p/2) + (c2 + 1.5a2)(sin p — p/2) (p/2 + 2)a1 — b1 — (p/2 + 2)a2 — b2]/1 — p21
| — (c1 + 1.5a1 )(sin p + p/2) + (c2 + 1.5a2)(sin p — p/2) (p/2 + 2)a1 — b1 — (p/2 + 2)a2 — b2]/1 — p21
|
which is to be used in Eq. 8.27 to calculate the suction force. Knowing P from Eq. 8.55, the quasi unsteady lift from Eq. 8.54, and the equivalent angle of attack from quasi-steady lift, i. e. a = cl/2p, we can obtain the propulsive force S from Eq. 8.27.
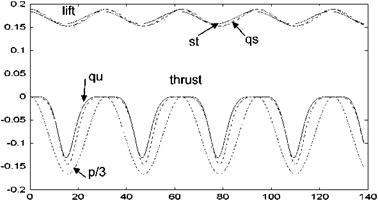
The effect of the unsteady motion of the camber location is studied under various conditions for the maximum camber location changing with p = — 0.25[1 – cos (ks)], where s = Ut/b is the reduced time. Shown in Fig. 8.41 are the typical lift and thrust variation plots for the cambered thin airfoil having chordwise flexibility with maximum camber of 3% and reduced frequency of k = 0.2. The quasi unsteady lift and thrust coefficients shown with continuous lines indicates the expected phase lag between the motion and the aerodynamic response. Since the reduced frequency k = 0.2 is small, the differences among the steady, quasi steady and the quasi unsteady lift and thrust coefficients are not too large. According to Fig. 8.41, the maximum lift and the zero thrust are obtained for p = 0 for which the maximum camber is at the midchord, and the minimum lift and the maximum thrust are achieved when the maximum is at quarter chord.
The averaged suction force coefficients obtained by time integration of the curves over a period given in Fig. 8.41 are represented in Table 8.5 for (a) steady, st, (b) quasi steady, qs, and (c) quasi unsteady cases, qu. According to Table 8.5, the force coefficient becomes smaller for quasi-unsteady treatment with increasing reduced frequency.
For a flat plate at Re = 10,000 the drag coefficient according to Blasius is cd = 0.0266. The boundary layer solution obtained with the procedure as
|
Table 8.5 Averaged thrust coefficients for a = 3%
|
described in Appendix 10, and based on the edge velocity given by Eq. 8.53, gives the viscous drag opposing to the motion as 0.0286 for k = 0.2 and 0.0266 for k = 0.8. This shows that the smallest propulsive force coefficient 0.0341, obtained with quasi unsteady approach for k = 0.8, for an airfoil morphing with a fixed camber ratio of 3%, easily overcomes the viscous drag produced by the chordwise flexible airfoil.
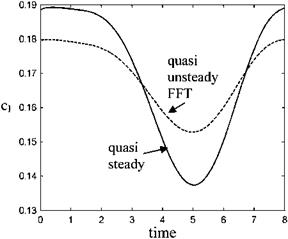
The chordwise change in the camber is considered simple harmonic. However, the associated downwash w given by Eq. 8.48 is no longer simple harmonic, especially for motions having high frequencies. Shown in Fig. 8.42 is the quasi steady lift, Eq. 8.52, change with time and the quasi unsteady lift obtained with the FFT applied to the equivalent motion whose angle of attack determined via Eq. 8.49 as an arbitrary motion. Comparison of Figs. 8.41 and 8.42 shows the effect of the reduced frequency, which is low for the small values of k, on the lift coefficient amplitude of the chordwise flexible motion, whereas the time averaged lift coefficient is almost the same for quasi steady and the quasi unsteady approaches as seen in Fig. 8.42.
The full unsteady approach includes the apparent mass term given by the second term of the right hand side of Eq. 3.27. The apparent mass term contributes to lift but makes zero contribution to leading edge suction term.
 |
 |
In this section we have analyzed the active chordwise flexibility of a thin airfoil. There are experimental, in water tunnels (Heatcote and Gursul 2007), as well as numerical studies based on fluid-structure interaction (Zhu 2007) concerning the passive flexibility with known or assumed elastic behavior of the thin hydrofoil flapping in water. The experimental and the numerical results agree well for the deformation of a thin and a thick flexible steel plate undergoing periodic heaving motion. The results obtained for a pitching plunging elastic airfoil by Zhu indicate that with increasing stiffness the thrust coefficient increases while the efficiency decreases. The effect of the maximum angle of attack is, however, opposite i. e. the
efficiency increases and the thrust coefficient decreases as the maximum effective angle of attack increases. The behavior of the steel plate in air as inertia driven deformation is somewhat similar at least qualitatively. However, for low stiffness values both the thrust and the efficiency are very small. Furthermore, the thrust becomes negative, which implies drag, for even lower values of stiffness.


