Generic Scramjet Inlet: The Shock-on-Lip Situation
Shock wave/boundary-layer interaction at a generic two-ramp inlet configuration with different wall temperatures was studied experimentally by T. Neuenhahn with the TH2 shock tunnel of the Shock Wave Laboratory of the RWTH Aachen University, Germany [12]. We discuss here only the matter of the ramp-shock position with respect to the inlet cowl leading edge as function of the wall temperature. The shock-on-lip condition is a layout objective for CAV’s and ARV’s, see, e. g., [1].
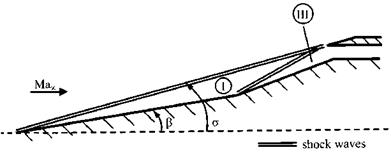
The geometry of the two-ramp inlet model with internal electrical resistance heating is shown in Fig. 10.9 together with the oblique shock waves of the inviscid flow. The inlet has a sharp leading edge in order to avoid entropy layer influences.
|
Fig. 10.9. Schematic of the sharp-edged two-ramp inlet with the oblique ramp shock waves [12]. The angle of the first ramp is ві = в = 9°, that of the second ramp в2 = 20.5°, the angel of the first oblique shock wave is a = a(Mві). |
The flow parameters of interest for us are given in Table 10.8. Of the two test conditions used in the experimental study, only condition I is relevant.
|
Table 10.8. Test conditions of the two-ramp inlet flow [12].
|
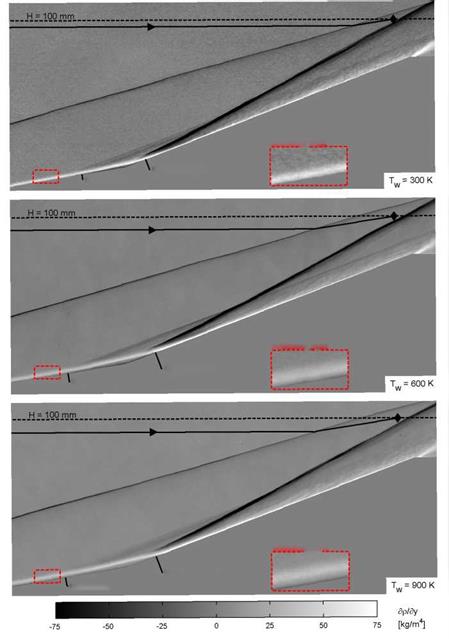
Schlieren pictures of the inlet flow for the wall temperatures Tw = 300 K, 600 K, and 900 K are given in Fig. 10.10.

|
|
|
|
|
|
|
|
|
|
|
|
|
|
|
|
|
|
|
|
|

The broken lines and the diamonds in the upper right corners of each of the pictures indicate the location of the leading edge of the assumed cowl lip (H = 100 mm). It represents the inviscid design point in which the two ramp shocks are directed on the lip. This shock-on-lip situation leads to the highest mass flow into the propulsion system.
The three schlieren images give important information regarding viscous effects as such and also regarding viscous thermal surface effects. Take the Tw = 300 K case. The boundary layer on the first ramp due to its displacement thickness shifts the oblique shock wave upwards compared to the inviscid layout situation. The result is that a lower mass flow enters the inlet. This is indicated by the streamline which impinges on the diamond after it has been deflected by the oblique shock wave. The mass flow hence is 2.6 per cent smaller than the inviscid layout mass flow. This mass-flow defect is called the spillage flow.
If the wall temperature is enlarged, the displacement effect of the boundary layer on the first ramp is enlarged, and the now slightly steeper shock wave is further shifted upwards.[176] The spillage flow increases. For the highest wall temperature Tw = 900 K it finally reaches 5.2 per cent.
These results tell us the importance to take into account in inlet design both viscous effects and thermal surface effects. In the reality of course the flow situation is much more complex as in this generic inlet case. In design work the understanding of the effects as well as the limitations of both ground – facility simulation and computational simulation is mandatory.
10.2 Problems
Problem 10.1. Derive the proportionalities to the reference temperature of the flat-plate thicknesses of compressible laminar and turbulent twodimensional boundary layers as well as that of the viscous sub-layer. Employ the relations for the Blasius and the 1-th-power turbulent boundary layer. Assume ш = 0.65. Compare with the values given in Table 10.1.
Problem 10.2. Write for eq. (10.1) the proportionalities to T*/Te for both laminar and turbulent flow.
Problem 10.3. Compute the ratio of the two boundary-layer thicknesses STw =воок/$тт=ілоок of the case in Section 10.4. Measure the thicknesses in Fig. 10.1 and compare.
Problem 10.4. From Fig. 10.4 in Section 10.7 the skin-friction coefficients for case a) and case b) were read to be cf, a « 0.005-0.0025, and cf, b ~ 0.003-0.0015. Find the reference-temperature values and compare.


