AIRFOIL CHARACTERISTICS ABOVE STALL
The characteristics of airfoils operating at angles of attack above stall are of importance in analyzing airplane off – design conditions and helicopter rotors operating at high forward speeds where reverse flow can be encountered. Normally airfoils operate in the range of angle of attack from near zero at zero CL to angles 10 to 20 degrees above that, and produce a maximum lift coefficient in the range of 1.0 to 1.6 plus. Upon increasing the angle of attack above CLX , The flow detaches (separates), more or less suddenly, from the suction or upper side of the airfoil. After reaching its maximum CL will drop to a value of 0.8 to 1.0 and then increases again as the angle of attack is further increased. This latter increase in lift is caused by a combination of the impact pressure on the lower surface together with some scavenging effect of the outer flow along the boundaries of the wake originating from the upper side. The scavenging results in a negative pressure differential, or suction, on the upper surface. Finally, the whole aggregate will result in some circulation. All this amounts to the fact that lift is derived from changes in momentum in the fluid flow, both in the direction of motion (drag) and in a direction normal to that motion.
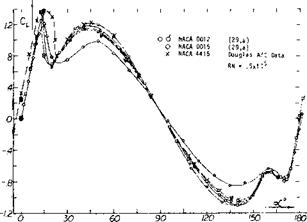
The two dimensional characteristics of airfoils in the angle of attack range of 0 to 180 degrees are given in figure 33 for NACA 0012, 0015 and 63A-012 airfoils (29,a, c). The results for all the 12% thick airfoils agree closely. Above an angle of 20 degrees indicating that shape has little effect on the lift variation at high angle. The results given in figure 33 also indicate that:
(a) After stalling, the resultant force acting on the airfoil section is essentially normal to the chord line.
(b) Lift reaches a second maximum at oc^45° with a value on the order of CL = 1.0.
(c) Together with the drag at 45° (corresponding to CD ~1.0) the normal force at that angle amounts to Сы ~ГГ~1А.
(d) At oc = 90° CN = CD ^1.8. The normal force thus reaches a maximum at this angle of attack, in a manner similar to the theoretical lift coefficient.
(e) Lift is approximately zero at 90°; and the drag coefficient is 1.8, which is similar to that of a flat plate (CD ^ 1.95).
(0 At angles of attack between 90°and 180°, the sharp trailing edge becomes a leading edge, while the round leading edge has to perform as a trailing edge. The variation of the drag and lift coefficients in this region is similar to that between 0 and 90 .
The two dimensional airfoil data presented on figure 33 was obtained primarily for use in helicopter rotor analysis. However, definition of the flow conditions required for correcting these data for their use in rotor analysis are not yet available. Testing of various airfoils on actual rotors is recommended (29) to account for all the variables, since the effects of three dimensional flow are of great importance. Three dimensional flow due to leakage may account for the difference between the NACA 0015 and 0012 airfoil data of figure 33.
|
|
|
Figure 33. Variation of lift coefficient for angles of attack 0 to 180 degrees. |
Correlation of Theory*. Analysis of the experimental results presented in figure 33 is as follows. First, multiply the theoretical lift function (30) given as equation (15) by cos or
CL =271′ sin oc (15)
to account for the loss of suction around the round leading edge of the section. We must next reduce the constant term 2тг, to account for the loss of circulation due to separation. The test lift coefficients are thus approximately represented by
Cl = (1.8 to 2.0) sin oc cos <x (16) [50]
from the geometry, we also obtain
|
CD = (1.8 to 2.0) sin2 oc |
(17) |
|
СДІ = (1.8 to 2.0) sin oc |
(18) |
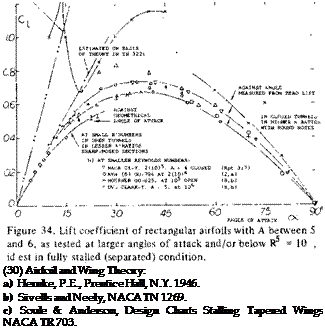
Fully Stalled Wings. In the range of small Reynolds numbers (roughly below Rc= 10*) the boundary layer flow past rounded section noses stays completely laminar; separation follows at zero angle of attack from a theoretically traceable point on the upper side of the section, the location of which is independent of the Reynolds number, but dependent upon the angle of attack. As a consequence, the flow completely separates from the suction side and the lift is mainly due to the pressure forces on the lower side. This type of lift also reaches a maximum as the angle of attack is sufficiently increased; and the maximum lift coefficient is essentially independent of Reynolds number.
Experimental points representing fully stalled (separated) conditions are plotted in figure 34. The maximum lift coefficient is between 0.6 and 0.7, at an angle of attack (for airfoils with A = 5 or 6) in the vicinity of 40°. It seems that the influence of Reynolds number in the range below 105 to above 10is small in this range of fully stalled flow. At angles of attack below 60°, the highest values tested belong to cambered and round-nosed sections, while the lowest values are formed at negative angles of attack (simulating negative camber). Also, the stalled values of lift coefficients measured in closed wind tunnels are somewhat higher, and lower in open-jet-type tunnels.
a) AT HIGHER REYNOLDS NUMBERS:
О 00-420 (18.7/4.5)% AVA 4(10) , A = 5 (17,a)
r AVA, A = 5 FLAT PLATE 4(10)5 (17,a)
A DITTO, 10% CAMBERED PLATE, OPEN TUNNEL(I7,a)
7 NACA Cl-Y, A = 6 CLOSED 6(10)5 (TN-443/451)
Г DVL SY»*ffiTRICAL 3(10)6, A = 5 (8,b)
* DVL Cl-Y, 3U0)6, A = 5, OPEN (8,b)
A = 6 USUAL Д VDT, GO-398 ( /4.9)% CLOSED (TN 397,412.’
 LIFT-CURVE SLOPE „ □ NACA USA-27, A = 6, CLOSED (TN 397,412)


