Aerodynamic FORCE COEFFICIENT
The aerodynamic forces of lift and drag depend on the combined effect of many different variables. The important single variables could be:
(1) Airstream velocity
(2) Air density
(3) Shape or profile of the surface
(4) Angle of attack
(5) Surface area
(6) Compressibility effects
(7) Viscosity effects
If the effects of viscosity and compressibility are not of immediate importance, the remaining items caq be combined for consideration. Since the major aerodynamic forces are the result of various pressures distributed on a surface, the surface area will be a major factor. Dynamic pressure of the airstream is another common denominator of aerodynamic forces and is a major factor since the magnitude of a pressure distribution depends on the source energy of the free stream. The remaining major factor is the relative pressure distribution
existing on the surface. Of course, the velocity distribution, and resulting pressure distribution, is determined by the shape or profile of the surface and the angle of attack. Thus, any aerodynamic force can be represented as the product of three major factors: the surface area of the object the dynamic pressure of the airstream the coefficient or index of force determined by the relative pressure distribution This relationship is expressed by the following equation:
F=CyqS
where
F = aerodynamic force, lbs.
CF=coefficient of aerodynamic force q=dynamic pressure, psf
=bv*
S= surface area, sq. ft.
In order to fully appreciate the importance of the aerodynamic force coefficient, CF, the above equation is rearranged to alternate forms:
|
|
C,= *£
1
In this form, the aerodynamic force coefficient is appreciated as the aerodynamic force per surface area and dynamic pressure. In other words, the force coefficient is a dimensionless ratio between the average aerodynamic pressure (aerodynamic force‘per area) and the air – stream dynamic pressure. All the aerodynamic forces of lift and drag are studied bn this basis— the common denominator in each case being surface area, and dynamic pressure. By such a definition, a "lift coefficient” would be the ratio between lift pressure and dynamic pressure; a "drag coefficient” would be the ratio between drag pressure and. dynamic pressure. The use of the coefficient form of an aerodynamic force is necessary since the force coefficient is:
(1) An index of the aerodynamic force independent of area, density, and velocity.
It is derived from the relative pressure and velocity distribution.
(2) Influenced only by the shape of the surface and angle of attack since these factors determine the pressure distribution.
(3) An index which allows evaluation of the effects of compressibility and viscosity. Since the effects of area, density, and velocity are obviated by the coefficient form, compressibility and viscosity effects can be separated for study.
THE BASIC LIFT EQUATION. Lift has been defined as the net force developed perpendicular to the relative wind. The aerodynamic force of lift on an airplane results from the generation of a pressure distribution on the wing. This lift force is described by the following equation:
L^CtfS
where
L=lift, lbs.
Cl = lift coefficient. q—dynamic pressure, psf
-h>v*
wing surface area, sq. ft.
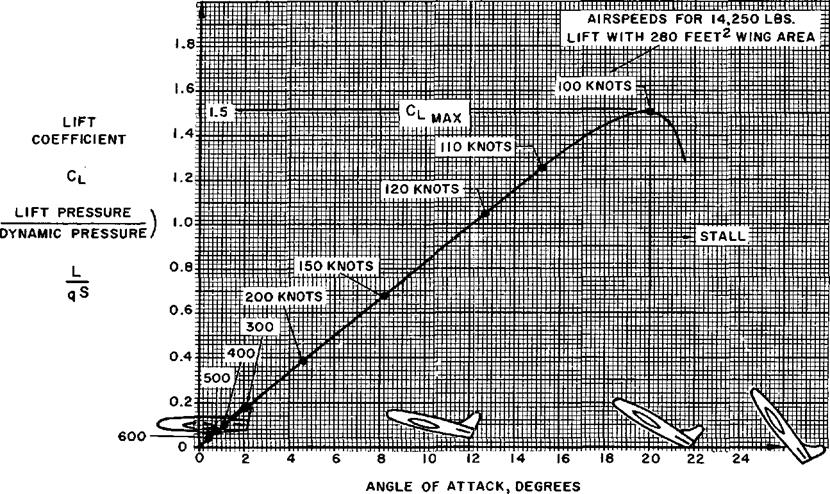
The lift coefficient used in this equation is the ratio of the lift pressure and dynamic pressure and is a function of the shape of the wing and angle of attack. If the lift coefficient of a conventional airplane wing planform were plotted versus angle of attack, the result would be typical of the graph of figure 1.11. Since the effects of speed, density, area, weight, altitude, etc., are eliminated by the coefficient form, an indication of the true lift capability is obtained. Each angle of attack produces a particular lift coefficient since the angle of attack is the controlling factor in the pressure distribution. Lift coefficient increases with angle of attack up to the maximum lift coefficient, Сйпах, and, as angle of attack is increased beyond the maximum lift angle, the airflow is unable to adhere to the upper surface. The airflow then separates from the upper surface and stall occurs.
INTERPRETATION OF THE LIFT EQUATION. Several important relationships are
|
|
![]()
![]()
![]()
![]()
![]()
![]()
![]()
![]()
![]()
![]()
derived from study of the basic lift equation and the typical wing lift curve. One important fact to be appreciated is that the airplane shown in figure 1.11 stalls at the same angle of attack regardless of weight, dynamic pressure, bank angle, etc. Of course, the stall speed of the aircraft will be affected by weight, bank angle, and other factors since the product of dynamic pressure, wing area, and lift coefficient must produce the required lift. A rearrangement of the basic lift equation defines this relationship.
Я the airplane is flown in steady, level flight at sea level with lift equal to weight the stall speed would be:
Thus, a sea level airspeed (or EAS) of 100 knots would provide the dynamic pressure necessary at maximum lift to produce 14,250 lbs. of lift. If the airplane were operated at a higher weight, a higher dynamic pressure would be required to furnish rhe greater lift and a higher stall speed would result. If the airplane vere placed in a steep turn, the greater lift required in the turn would increase the stall speed. If the airplane were flown at a higher density altitude the TAS at stall would increase. However, one factor common to each of these conditions is that the angle of attack at CLmax is the зяте. 11 is important to realize that stall warning devices must sense angle of attack (a) or pressure distribution (related to Ci).
Another important fact related by the basic lift equation and lift curve is variation of angle of attack and lift coefficient with airspeed. Suppose that the example airplane is flown in steady, wing level flight at various airspeeds with lift equal to the weight. It is obvious that an increase in airspeed above the stall speed will require a corresponding decrease in lift coefficient and angle of attack to maintain steady, lift-equal-weight flight. The exact relationship of lift coefficient and airspeed is evolved from the basic lift equation assuming constant lift (equal to weight) and equivalent airspeeds.
|
|
The example airplane was specified to have:
Weight = 14,250 lbs.
C,„=15
F,= 100 knots EAS
The following table depicts the lift coefficients and angles of attack at various airspeeds in steady flight.
|
|
|
V, knots |
CL ҐУ. у ~v) |
CL |
a |
|
100………………………. |
1.000 |
1.50 |
20.0° |
|
uo………………………… |
.826 |
1.24 |
15.2° |
|
120………………………. |
.694 |
1.04 |
12.7° |
|
150 ……………………… |
.444 |
.67 |
8.2° |
|
200………………………. |
.250 |
.38 |
4.6° |
|
300 ……………………… |
• 111 |
.17 |
2.1° |
|
400 ……………………… |
.063 |
.09 |
1.1° |
|
500………………………. |
.040 |
.06 |
.7° |
|
600………………………. |
.028 |
.04 |
.5° |
Note that for the conditions of steady flight, each airspeed requires a specific angle of attack and lift coefficient. This fact provides a fundamental concept of flying technique: Angle of attack is the primary control of airspeed in steady flight. Of course, the control stick or wheel allows the pilot to control the angle of attack and, thus, control the airspeed in steady flight. In the same sense, the throttle controls the output of the powerplant and allows the pilot to control rate of climb and descent at various airspeeds.
The real believers of these concepts are professional instrument pilots, LSO’s, and glider pilots.- The glider pilot (or flameout enthusiast) has no recourse but to control airspeed by angle of attack and accept whatever rate of descent is incurred at the various airspeeds. The LSO must become quite proficient at judging the flight path and angle of attack of the airplane in the pattern. The more complete visual reference field available to the LSO allows him to judge the angle of attack of the airplane more accurately than the pilot. When the airplane approaches the LSO, the precise judgment of airspeed is by the angle of attack rather than the rate of closure. If the LSO sees the airplane on the desired flight path but with too low an angle of attack, the airspeed is too high; if the angle of attack is too high, the airspeed is too low and the airplane is approaching the stall. The mirror landing system coupled with an angle of attack indicator is an obvious refinement. The mirror indicates the desired flight path and the angle of attack indicator allows precision control of the airspeed. The accomplished instrument pilot is the devotee of ‘“attitude” flying technique—his creed being ‘‘attitude plus power equals performance.” During a GCA approach, the professional instrument pilot controls airspeed with stick (angle of attack) and rate of descent with power adjustment.
Maneuvering flight and certain transient conditions of flight tend to complicate the relationship of angle of attack and airspeed. However, the majority of flight and, certainly, the most critical regime of flight (takeoff, approach, and landing), is conducted in essentially steady flight condition.
AIRFOIL LIFT CHARACTERISTICS. Airfoil section properties differ from wing or airplane properties because of the effect of the planform. Actually, the wing may have various airfoil sections from root to tip with taper, twist, sweepback and local flow components in a spanwise direction. The resulting aerodynamic properties of the wing are determined by the action of each section along the span and the three-dimensional flow. Airfoil section properties are derived from the basic shape or profile in two-dimensional flow and the force coefficients are given a notation of lower case letters. For example, a wing or airplane lift coefficient is CL while an airfoil section lift coefficient is termed ct. Also, wing angle of attack is a while section angle of attack is differentiated by the use of a0. The study of section properties allows an objective consideration of the effects of camber, thickness, etc.
The lift characteristics of five illustrative airfoil sections are shown in figure 1.12. The section lift coefficient, ci, is plotted versus section angle of attack, «о, for five standard NACA airfoil profiles. One characteristic feature of all airfoil sections is that the slope of the various lift curves is essentially the same. At low lift coefficients, the section lift coefficient increases approximately 0.1 for each degree increase in angle of attack. For each of the airfoils shown, a 5° change in angle of

SECTION ANGLE OF ATTACK
®0>DEGREES
attack would produce an approximate 0,5 change in lift coefficient. Evidently, lift curve slope is not a factor important in the selection of an airfoil.
An important lift property affected by the airfoil shape is the section maximum lift coefficient, ci. The effect of airfoil shape on ci can be appreciated by comparison of the lift curves for the five airfoils of figure 1.12. TheNACA airfoils 63ЧЮ6, 63ЧЮ9, and 63i-012 are symmetrical sections of a basic thickness distribution but maximum thicknesses of 6, 9, and 12 percent respectively. The effect of thickness on ci is obvious from an inspection of these curves:
|
Section |
“°f0r4na, |
|
|
NACA 6ЯЮ6……………………………. ;………… |
0.82 |
9.0° |
|
IvJACA fiVOOQ…………………………………… |
1.10 |
10.5° |
|
NACA 63,-012 ……………………………………… |
1.40 |
13.8° |
The 12-percent section has a ctwa approximately 70 percent greater than the 6-percent thick section. In addition, the thicker airfoils have greater benefit from the use of various high lift devices.
The effect of camber is illustrated by the lift curves of the NACA 4412 and 63i-412 sections. The NACA 4412 section is a 12 percent thick airfoil which has 4 percent maximum camber located at 40 percent of the chord. The NACA 63i-412 airfoil has the same thickness and thickness distribution as the 63r~012 but camber added to give a “design” lift coefficient (ci for minimum section drag) of 0.4. The lift curves for these two airfoils show that camber has a beneficial effect on Cimax.
|
Section |
ao for ci щах |
|
|
N АСА 63,-012 (sy mmettkal)……… ■………… |
1,40 |
13.8° 15.2° |
|
NACA 63i-412 (Gunbered)…………………… |
1.73 |
|
An additional effect of camber is the change in zero lift angle. While the symmetrical sections have zero lift at zero angle of attack, the sections with positive camber have negative angles for zero lift.
The importance of maximum lift coefficient is obvious. If the maximum lift coefficient is high, the stall speed will be low. However, the high thickness and camber necessary for high section maximum lift coefficients may produce low critical Mach numbers and large twisting moments at high speed. In other words, a high maximum lift coefficient is just one of the many features desired of an airfoil section.
DRAG CHARACTERISTICS. Drag is the net aerodynamic force parallel to the relative wind and its source is the pressure distribution and skin friction on the surface. Large, thick bluff bodies in an airstream show a predominance of form drag due to the unbalanced pressure distribution. However, streamlined bodies with smooth contours show a predominance of drag due to skin friction. In a fashion similar to other aerodynamic forces, drag forces may be considered in the form of a coefficient which is independent of dynamic pressure and surface area. The basic drag equation is as follows:
D=CDqS
where
D = drag, lbs.
Co^drag coefficient q= dynamic pressure, psf
= ^5 ^ ІП knots’ TAS)
L=wing surface area, sq. ft.
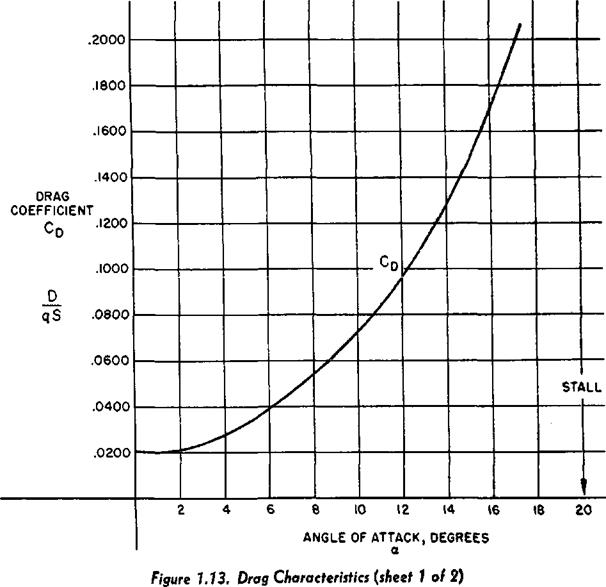
The force of drag is shown as the product of dynamic pressure, surface area, and drag coefficient, Cn. The drag coefficient in this equation is similar to any other aerodynamic force coefficient—it is the ratio of drag pressure to dynamic pressure. If the drag coefficient of a conventional airplane were plotted versus angle of attack, the result would be typical of the graph shown in figure 1.13. At low angles of attack the drag coefficient is low and small changes in angle of attack create only slight changes in drag coefficient. At
|
|
|
|
 |
|
|

higher angles of attack the drag coefficient is much greater and small changes in angle of attack cause significant changes in drag. As stall occurs, a large increase in drag takes place.
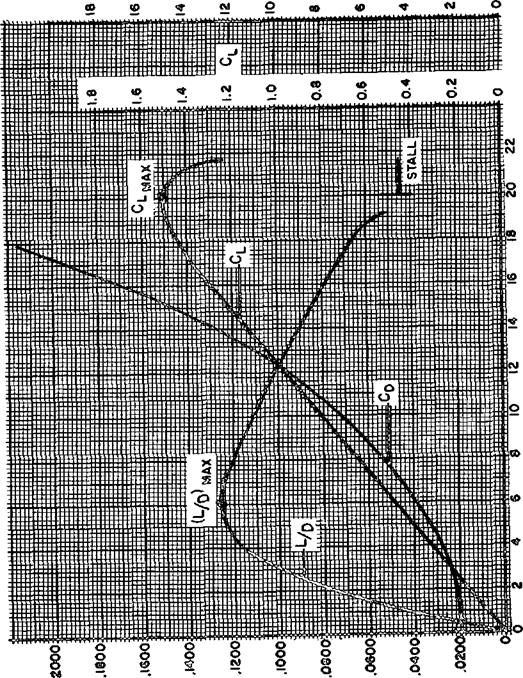
A factor more important in airplane performance considerations is the lift-drag ratio, LjD. With the lift and drag data available for the airplane, the proportions of CL and CD can be calculated for each specific angle of attack. The resulting plot of lift-drag ratio with angle of attack shows that LjD increases to some maximum then decreases at the higher lift coefficients and angles of attack. Note that the maximum lift-drag ratio, (L/D)max, occurs at one specific angle of attack and lift coefficient. If the airplane is operated in steady flight at (L/L>)mai, the total drag is at a minimum. Any angle of attack lower or higher than that for (L/X))moi reduces the lift-drag ratio and consequently increases the total drag for a given airplane lift.
The airplane depicted by the curves of Figure 1.13 has a maximum lift-drag ratio of 12.5 at an angle of attack of 6°. Suppose this airplane is operated in steady flight at a gross weight of 12,500 lbs. If flown at the airspeed and angle of attack corresponding to (L/D)max, the drag would be 1,000 lbs. Any higher or lower airspeed would produce a drag greater than 1,000 lbs. Of course, this same airplane could be operated at higher or lower gross weights and the same maximum lift-drag ratio of 12.5 could be obtained at the same angle of attack of 6°. However, a change’ in gross weight would require a change in airspeed to support the new weight at the same lift co
The configuration of an airplane has a great effect on the lift-drag ratio. Typical values of (LjDax are listed for various types of airplanes. While the high performance sailplane may have extremely high lift-drag ratios, such an aircraft has no real economic or tactical purpose. The supersonic fighter may have seemingly low lift-drag ratios in subsonic flight but the airplane configurations required for supersonic flight (and high [LjD]’* at high Mach numbers) precipitate this situation.
Many important items of airplane performance are obtained in flight at (LjD’)max. Typical performance conditions which occur at (LjD’)max are:
maximum endurance of jet powered airplanes
maximum range of propeller driven airplanes
maximum climb апф for jet powered airplanes
maximum power-off glide range, jet or prop
The most immediately interesting of these items is the power-off glide range of an airplane. By examining the forces acting on an airplane during a glide, it can be shown that the glide ratio is numerically equal to the lift-drag ratio. For example, if the airplane in a glide has an (L/D) of 15, each mile of altitude is traded for 15 miles of horizontal distance. Such a fact implies that the airplane should be flown at (LjD’)max to obtain the greatest glide distance.
An unbelievable feature of gliding performance is the effect of airplane gross weight. Since the maximum lift-drag ratio of a given airplane is an intrinsic property of the aerodynamic configuration, gross weight will not affect the gliding performance. If a typical jet trainer has an (L/D)^ of 15, the aircraft | can obtain a maximum of 15 miles horizontal distance for each mile of altitude. This would be true of this particular airplane at any gross
Revised January 1965
weight if the airplane is flown at the angle of attack for. Of course, the gross
weight would affect the glide airspeed necessary for this particular angle of attack but the glide ratio would be unaffected.
AIRFOIL DRAG CHARACTERISTICS. The total drag of an airplane is composed of the drags of the individual components and the forces caused by interference between these components. The drag of an airplane configuration must include the various drags due to lift, form, friction, interference, leakage, etc. To appreciate the factors which affect the drag of an airplane configuration, it is most logical to consider the factors which affect the drag of airfoil sections. In order to allow an objective consideration of the effects of thickness, camber, etc., the properties of two-dimensional sections must be studied. Airfoil section properties are derived from the basic profile in two-dimensional, flow and are provided the lower case shorthand notation to distinguish them from wing or airplane properties, c. g., wing or airplane drag coefficient is CD while airfoil section drag coefficient is cd.
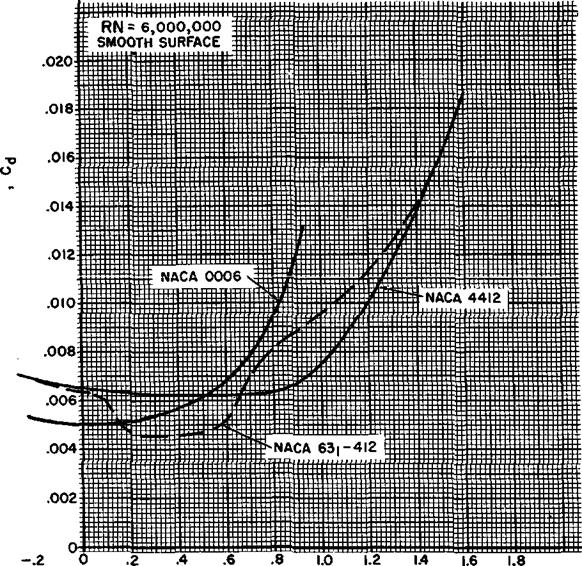
The drag characteristics of three illustrative airfoil sections are shown in figure 1.14. The section drag coefficient, cd, is plotted versus the section lift coefficient, Ci. The drag on the airfoil section is composed of pressure drag and skin friction. When the airfoil is at low lift coefficients, the drag due to skin friction predominates. The drag curve for a conventional airfoil tends to be quite shallow in this region since there is very little variation of skin friction with angle of attack. When the airfoil is at high lift coefficients, form or pressure drag predominates and the drag coefficient varies rapidly with lift coefficient. The NACA 0006 is a thin symmetrical profile which has a maximum thickness of 6 percent located at 30 percent of the chord. This section shows a typical variation of cd and ci.
The NACA 4412 section is a 12 percent thick airfoil with 4 percent maximum camber at 40 percent chord. When this section is compared with the NACA 0006 section the effect of camber can be appreciated. At low lift coefficients the thm, symmetrical section has much lower drag. However, at lift coefficients above 0.5 the thicker, cambered section has the lower drag. Thus, proper camber and thickness can improve the lift-drag ratio of the section.
The NACA 63i-412 is a cambered 12 percent thick airfoil of the “laminar flow” type. This airfoil is shaped to produce a design lift coefficient of 0.4. Notice that the drag curve of this airfoil has distinct aberrations with very low drag coefficients near the lift coefficient of 0.4. This airfoil profile has its camber and thickness distributed to produce very low uniform velocity on the forward surface (minimum pressure point well aft) at this lift coefficient. The resulting pressure and velocity distribution enhance extensive laminar flow in the boundary layer and greatly reduce the skin friction drag. The benefit of the laminar flow is appreciated by comparing the minimum drag of this airfoil with an airfoil which has one-half the maximum thickness—the NACA 0006.
The choice of an airfoil section will depend on the consideration of’many different factors. While the of the section is an important quality, a more appropriate factor for consideration is the maximum lift coefficient of the section when various high lift devices are applied. Trailing edge flaps and leading edge high lift devices are applied to increase the clmax for low speed performance. Thus, an appropriate factor for comparison is the ratio of section drag coefficient to section maximum lift coefficient with flaps—cdjclmf. When this quantity is corrected for compressibility, a preliminary selection of an airfoil section is possible. The airfoil having the lowest value of eje^ at the design flight condition (endurance, range, high speed, etc.) will create the least section drag for a given design stall speed.
|
|
SECTION LIFT COEFFICIENT
0Л
Figure 1.14. Drag Characteristics of Typical Airfoil Sections
![]()
![]()
![]()


