High-Lift Considerations
Requirements such as short take-off and landing can be met by increasing the lift of the lifting surfaces. If this is done by increasing the wing’s lift coefficient then a smaller wing surface can be designed (meaning less cruise drag, less weight, etc.). Engineering solutions to this operational requirement within various lift coefficient ranges resulted in many ingenious approaches and a comprehensive survey is given by Smith.1413 A logical approach is to increase the lift coefficient of a lifting surface by delaying flow separation, but changing the wing area and shape in reaction to the changing flight conditions (e. g., airplane flaps) is also very common. In this section we shall briefly discuss some of the features of single and multielement high-lift airfoils.
|
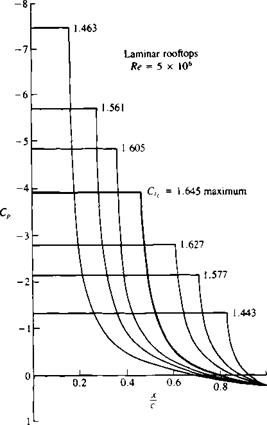
FIGURE 14.19 Family of possible airfoil upper-surface pressure distributions resulting in an attached flow on the upper surface (for Re = 5 x 10⁶). From Liebeck.14’11 Reprinted with permission. Copyright AIAA. (Courtesy of Douglas Aircraft Co.) |
One approach is to develop a family of airfoil (upper surface) pressure distributions that will result in the most-delayed flow separation. In order to accomplish this the location of the separation point must be estimated, based on information from the potential flow and the boundary layer solutions. A simplified approach is to use a flow separation criterion such as the Stratford criterion (description of this criterion can be found in several aerodynamic books, e. g., Kuethe and Chow,14 8 sections 18.10 and 19.2). Using such a flow separation criterion, Liebeck14 10,14 11 developed the family of upper surface pressure distributions shown in Fig. 14.19. These curves depend on the Reynolds number, and in the case of Fig. 14.19, for a Reynolds number of
|
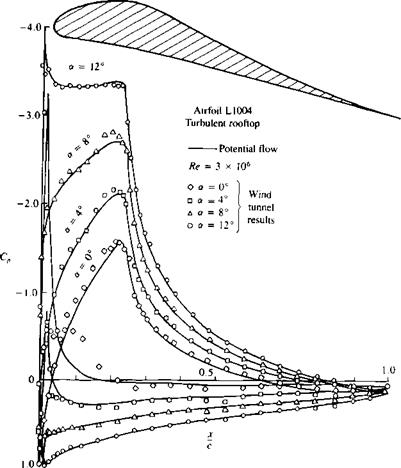
FIGURE 14.20 Shape of the L1004 airfoil and theoretical and experimental pressure distribution on it at various angles of attack. From Liebeck.14 10 Reprinted with permission. Copyright AIAA. (Courtesy of Douglas Aircraft Co.). |
FIGURE 14.21
 |
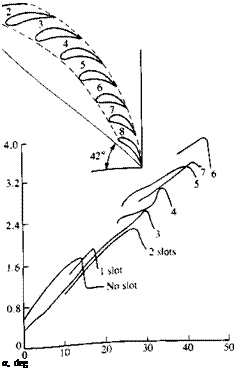
Lift coefficient versus angle of attack for the RAF 19 airfoil broken up to different numbers of elements. (Note that a two-element airfoil has 1 slot, a three-element airfoil has 2 slots, etc.) From Ref. 14.13. Reprinted with permission. Copyright AIAA.
5 x 10⁶, airfoils having any of the described upper pressure distributions will have an attached flow on that surface. Note that the maximum lift coefficient will increase toward the center of the group and the bold curve represents the pressure distribution yielding the highest lift due to the upper surface pressure distribution.
At this point it is clear that if, based on the nature of the boundary layer, the shape of the desired pressure distribution can be sketched, then an inverse method is required to find the corresponding (or the closest) practical airfoil shape. Based on this need many inverse, or “design mode” airfoil design methods were developed (e. g., Refs. 14.7 and 14.9-14.11). The airfoil shape based on using one of these pressure distributions is shown in the inset to Fig. 14.20 along with the potential flow based solutions and experimental pressure distribution (maximum lift is C, = 1.8, at a = 14°, and at Re = 3 x 10⁶). Note that at the lower angles of attack (at possible cruise conditions) there is a favorable pressure gradient near the front of the airfoil where a laminar boundary layer can be maintained for low drag (transition is near the maximum thickness section; also, at cr = 0° a laminar separation bubble appears on the lower surface near the leading edge—causing the discrepancy between the measured and calculated data).
Another method of obtaining a high lift coefficient is to have a variable wing geometry, where both surface area and airfoil camber can be changed according to the required flight conditions. Mechanically, a multielement airfoil can be considered as such a device since by changing flap angles the lift coefficient can be altered without changing the wing angle of attack. But the multielement design will inherently possess high lift capabilities. This was realized early in the beginning of this century and Handley Page14 14 showed experimentally that the greater the number of the elements the greater is the
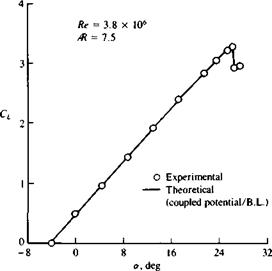 FIGURE 14.23
Lift coefficient versus angle of attack for a three-element wing shown in the inset to Fig. 14.22. Slat angle is —40°, trailing edge flap angle is 10°, and Re = 3.8 x 10⁶.
maximum lift coefficient. Figure 14.21 shows the results of Ref. 14.14 where the RAF 19 airfoil was broken up into different numbers of elements (note that a two-element airfoil will have one slot, a three-element airfoil two slots, etc.).
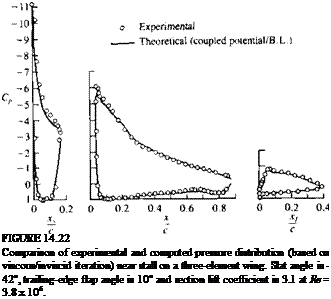
The pressure distribution and the lift versus angle of attack for a typical three-element wing section1415 are shown in Fig. 14.22; note that lift coefficients of over 3.0 can be obtained (Fig. 14.23). Since the overall effect of a flap is to increase the load on the element ahead of it, the leading edge slat
|
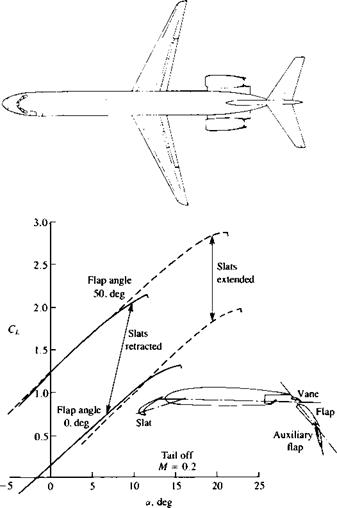
FIGURE 14.24 Effect of leading-edge slats and trailing-edge flaps on the lift curve of a DC-9-30 airplane (tail off, M = 0.2). (Courtesy of Douglas Aircraft Co.). |
(if not drooped) is the most likely to separate. Consequently, many airplanes will droop the leading edge slat at high lift coefficients to delay its flow separation. The effect of these devices is shown schematically in Fig. 14.24 and, in general, extending the slats will extend the range of angle of attack for maximum lift but will not increase the lift curve slope. Now, recall Example 3 of Section 5.4 about the flapped airfoil, which indicated that a flap at the trailing edge will have a large effect on the airfoil’s lift. This is clearly indicated in Fig. 14.24, where bringing the flap down by 50° results in an increase of the lift coefficient by close to 1.0.
The above discussion was mainly aimed at two-dimensional airfoil design, but as the wing aspect ratio becomes smaller the pressure distribution will be altered by the three-dimensional shape of the wing (see Fig. 12.31) and three-dimensional methods (either computational or experimental) must be used. Also, based on Figs. 14.21 and 14.22 it seems that with large aspect ratio wings, section lift coefficients of about 4 are possible and Smith14 13 estimates a hypothetical maximum section lift coefficient of Ал and shows a two-element airfoil with an estimated C, of about 5. For smaller aspect ratio wings a maximum lift coefficient of CLma = 1.2Ж is frequently quoted and this is probably a more conservative version of Hoerner’s14 16 CL<m = 1.94Ж formula. Hoerner also provides a limit on wing aspect ratio for this formula (p. 4-1) such that Ж < 6.
|
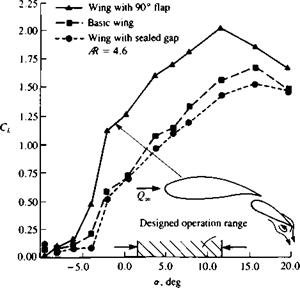
FIGURE 14.25 Effect of a small 90° flap on the lift of a two-element airfoil (Re = 0.3 x 10⁶). From Ref. 14.17. Reprinted with permission of ASME. |
At this point it is worth mentioning a very simple trailing-edge flap that will usually increase the lift of a wing. This small trailing-edge flap is shown schematically in the inset to Fig. 14.25 and flow visualization indicates that due to the small vortex created at the pressure side the trailing edge upper surface boundary layer will be thinner. This in effect turns the trailing edge flow downward and increases the wing’s circulation. Experimental results14 11,14 17 usually show a consistent increase in lift due to this device, which in most cases is accompanied by a slight increase in drag. In some limited situations (as in Ref. 14.11 where it was attached to a high-drag Newman airfoil) a reduction in drag may be observed also. (A sketch of the Newman airfoil’s shape can be found in Ref. 14.11.)


