Temperature Sensitive Paint
Temperature sensitive paint (TSP) is a polymer-based paint in which the temperature-sensitive luminescent molecules are immobilized. The quantum efficiency of luminescence decreases with increasing temperature; this effect associated with temperature is thermal quenching that serves as the major working mechanism for TSP. Over a certain temperature range, a relation between the luminescent intensity I and absolute temperature T can be written in the Arrhenius form
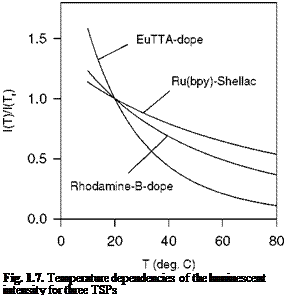
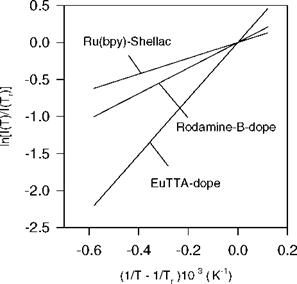
where Enr is the activation energy for the non-radiative process, R is the universal gas constant, and Tref is a reference temperature in Kelvin. Figures 1.7 and 1.8
show, respectively, the temperature dependencies of the luminescent intensity and the Arrhenius plots for three TSPs: Ru(bpy) in Shellac, Rodamine-B in dope and EuTTA in dope. The procedure for applying TSP to a surface is basically the same as that for PSP. Not only does TSP use the same measurement systems shown in Figs. 1.4 and 1.5, but also most data processing methods for TSP are similar to those for PSP. Ideally, TSP can be used in tandem with PSP to correct
the temperature effect of PSP and simultaneously obtain the temperature and pressure distributions. Compared to conventional temperature sensors, TSP is a global measurement technique that is able to obtain the surface temperature distribution with reasonable accuracy at a much higher spatial resolution.
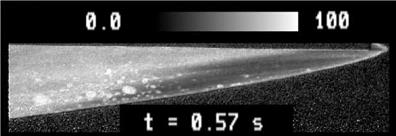
A family of TSPs has been developed, covering a temperature range of -196oC to 200oC. The accuracy of TSP is typically 0.2-0.8oC. TSP has been used in various aerodynamic experiments to measure the temperature and heat transfer distributions. In hypersonic wind tunnel tests, TSP not only visualized flow transition patterns, but also provided quantitative heat transfer data calculated based on quasi-steady and transient heat transfer models. Figure 1.9 shows a windward-side heat transfer image of the lower half of the waverider model at Mach 10 at 0.57 s after the wind tunnel started to run (Liu et al. 1995b), where the gray intensity bar denotes heat flux in kW/m2. TSP is an effective technique for visualizing boundary-layer transition from laminar to turbulent flow. Due to a significant difference in convection heat transfer between the laminar and turbulent flow regimes, TSP can visualize a surface temperature change across the transition line. In low-speed wind tunnel tests, a model is typically heated or cooled to increase the temperature difference. However, in high-speed flows, friction heating often produces a sufficient temperature difference for TSP transition visualization. Cryogenic TSPs have been used to detect boundary-layer transition on airfoils in cryogenic wind tunnels over a range of the total temperatures from 90 K to 150 K. Complemented with other techniques, TSP has been used to study the relationship between heat transfer and flow structures in an acoustically excited impinging jet. The mapping capability of TSP allows quantitative visualization of the impingement heat transfer fields controlled (enhanced or suppressed) by acoustical excitation. The heat transfer fields in complex separated flows induced by shock/boundary-layer interactions have also been studied using TSP. A novel heat transfer measurement technique has been developed, which combines a laser scanning TSP and a laser spot heating units into a single non-intrusive system. An infrared laser was used to generate local heat flux and convection heat transfer was determined based on a transient heat transfer model from the surface temperature response measured using TSP. This system was applied to quantitative heat transfer measurements in complex flows on a 75-degree swept delta wing and around an intersection of a strut and a wall. Through an optical magnification system, TSP can achieve a very high spatial resolution over the surface of a small object like MEMS devices. TSP has been used to measure the surface temperature field of a miniature flush-mounted hot – film sensor in a flat-plate turbulent boundary layer.
|
Fig. 1.8. The Arrhenius plots for three TSPs |
 |
|
Fig. 1.9. Heat transfer image obtained using TSP on the windward side of the waverider at Mach 10. From Liu et al. (1995b) |


