Applications of Temperature Sensitive Paint
10.1. Hypersonic Flows
The global surface heat transfer distributions on a waverider model at Mach 10 were measured by Liu et al. (1994b, 1995b) using EuTTA-dope TSP. The experiments were conducted in the Hypervelocity Wind Tunnel No. 9 at the Naval Surface Warfare Center (NSWC), a blow-down facility operating at the Mach Numbers of 8, 10, 14 and 16.5 with the corresponding maximum Reynolds numbers per foot of approximately 50×106 , 20×106, 3.8×10⁶ and 3.2×10⁶, respectively. The test cell diameter was 5 feet and the length was over 12 feet, which allowed for testing of large model configurations. Tunnel 9 used nitrogen as the working gas. The waverider model had an overall length of 39 inches, a span of 16.2 inches and a base height of 6.8 inches. The model was fabricated in eight parts. The body consisted of four sections manufactured from 6061-T6 aluminum. The nose, both leading edges, and the main cavity cover plate were manufactured from 17-4 PH stainless steel. Surface static pressures were measured at 32 locations on the model with Kulite pressure transducers (Model XCW-062-5A). Measurements of surface temperature rise were made using Medtherm model TCS-E-10370 coaxial thermocouples. A 0.1-mm-thick white Mylar layer covered the lower half of the windward side of the model from the centerline to the outboard edge. EuTTA-dope TSP (about 10 |am thick) was brushed on the Mylar layer. Ultraviolet illumination to excite the paint was provided by four 40-watt fluorescent black lights. Two CCD video cameras, viewing the front and back of the model separately, were used to image the TSP – coated surface. The analytical and numerical analyses of heat transfer on a thin insulating layer on a semi-infinite metallic body gave an estimate of required thickness of the insulating layer (about 0.1 mm). It was also proven that the discrete Fourier law was reasonably accurate as a simple heat transfer model for calculating heat flux from time-dependent TSP measurements in this case.
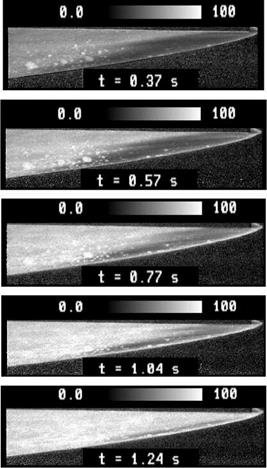
The experiment was run at the freestream Mach number of 10, average total pressure of 1300 psia and average total temperature of 1840oR. The wind tunnel run time was 2.3 seconds. The angle of attack was set at 10 degrees. Figure 10.1 shows windward side heat transfer maps of the lower half of the waverider (58% of the total length is shown in the images) at 0.37, 0.57, 0.77, 1.04 and 1.24 seconds after the wind tunnel started to run. The gray intensity bar in Fig. 10.1 denotes heat flux in kW/m2. The bright regions represent high heat transfer and
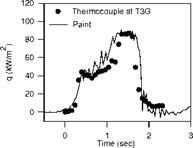
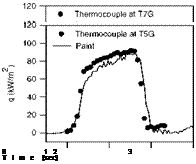
dark regions low heat transfer. In these maps, the low heat transfer region (dark region) downstream of the leading edge corresponds to laminar flow. Transition from laminar to turbulent flow can be easily identified as an abrupt change from low to high heat transfer. Also observed was a movement of the transition line toward the leading edge as the laminar region diminished when the surface temperature increased with time. Figure 10.2 shows typical temporal evolutions of heat transfer obtained by TSP at the locations near the thermocouples. The heat transfer history obtained by TSP was in agreement with that given by the thermocouples at these locations.
|
Fig. 10.1. Sequential heat transfer maps of the windward side of the waverider model at Mach 10. From Liu et al. (1995b) |
 |
 |
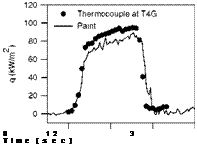 |
Fig. 10.2. History of heat transfer at four locations on the windward surface of the waverider model at Mach 10. From Liu et al. (1995b)
Hubner et al. (2002) applied TSP with a high-speed imaging system to measure full-field surface heat transfer rates on a 25°/55° indented cone model in short – duration hypersonic flows. Tests were performed in the 48-inch hypersonic shock tunnel (HST) and the LENS I tunnel facilities at the Calspan-University of Buffalo Research Center (CUBRC). Nominal test conditions ranged between the Mach numbers 9.5 and 11.1 and the Reynolds numbers 140,000 and 300,000 per meter with run times less than 10 ms. The indented cone model had the back diameter of 0.262 m. The model was fitted with a sharp-nose cap (0.194 m long) or a blunt-nose cap (6.4 mm radius). Over sixty platinum thin-film heat transfer gauges were aligned along a ray on the model. Additional gauges were installed azimuthally along the flare (aft) cone near the region of shock/boundary-layer interaction. TSP and an insulating layer were applied to 50% of the model for the HST tests and 25% of the model for the LENS I tests.
TSP used Ru-phen as an active sensing molecule. While Ru-phen itself exhibited oxygen quenching and hence pressure sensitivity, the luminophor was dissolved into an oxygen-impermeable polyurethane binder. TSP was applied over a white polyurethane insulating layer, and both were sprayed using conventional aerosol/airbrush equipment. The nominal TSP thickness and insulator thickness were 5-10 |im and 100-150 |im, respectively (+/-5 |im). Both
TSP and the insulating binders were polyurethane, thus exhibiting similar thermal characteristics. The average thermal conductivity and diffusivity of the insulator were 0.48 W/(K-m) and 2.7×10⁻⁷ m2/s, respectively, in a temperature range of 293323 K. The required insulating layer thickness was estimated to be the order of 100 microns for a run time of 10 ms based on a 1D transient heat transfer analysis assuming a step change in the heat transfer rate on a semi-infinite body. By minimizing the TSP thickness relative to the insulator thickness (while still achieving viable intensity measurements), the shortest time constant of TSP was achieved.
TSP was excited using a photographic xenon flash unit. Ultraviolet to blue excitation filters and orange-red emission filters were required to separate the luminescent emission from the excitation light. A combination of two Schott glass filters was utilized to filter the xenon flash excitation. For emission filtering, a 650 nm interference filter (80 nm bandpass) was used in conjunction with a high-pass Schott glass filter. A fast-framing CCD camera system was used, allowing on-chip framing rates from 15 to 1,000,000 frames per second (fps) with a frame capacity of 17 frames. The practical framing rates for the measurement system used at the CUBRC facilities were 100 to 5000 fps, depending on the duration of a test run, the desired sampling rate, and the ability to effectively detect the emission from TSP in short exposures. The advantage of the flexible framing rate was the ability to choose from a single long-exposure image or several short-exposure images during a single tunnel test. The frames were stored on the chip until all 17 frames were acquired, then data were transferred to a PC – installed frame grabber card. The CCD camera had a full-well capacity of
220,0 electrons and a readout noise of 70 electrons. The effective spatial resolution per frame was 248 by 248 pixels.
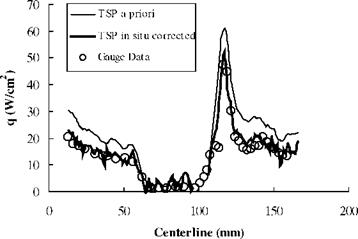
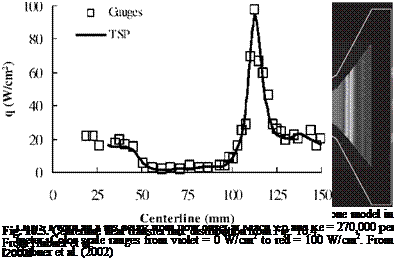
Figure 10.3 shows a typical Schlieren image of the flow field around the indented cone model. Visible was the intersection of the forebody shock and the aftbody (flare) shock. There was a separation region induced by the shock/boundary-layer and shock/shock interactions. The flow separation existed over the leading cone, and the flow reattached over the flare cone. Figure 10.4 is an in-situ calibrated heat transfer image for the model with the sharp-nose cap at Mach 9.6 and Re = 270,000 per meter in the LENS I tsets. The image shows a stabilized axisymmetric pattern although the asymmetric flow appeared in the transient stage of the onset of flow. Clearly present were the separated (violet) and shock/boundary layer interaction (yellow-red) regions. Where flow separation was present, the corresponding surface heat transfer rate was low (violet). Figure 10.5 shows the centerline heat transfer distributions obtained from TSP and gauge measurements. The relative rms calibration error of TSP measurements with the gauge measurements was 15%, which was mainly due to the high-frequency unsteadiness in the flow.
Fig. 10.3. Schlieren image of flow over the indented cone model. From Hubner et al.
 |
(2002)
Figure 10.6 shows time-dependent intensity-ratio images captured with a highspeed camera for the model with the sharp-nose cap at Mach 11 and Re = 140,000 per meter in the 48-inch HST tsets. The framing rate was 2000 fps (0.5 ms exposure). The image sequence from left to right shows the development of
surface heating. The first image taken just prior to the onset of flow indicates uniform temperature. The following two images, acquired while the tunnel conditions rose to the desired freestream conditions, show the flare shock impingement just aft of the intersection of the leading and flare cones. Afterwards, the separation region grew upstream and the shock impingement moved downstream. As time increased, the separated region and shock
impingement boundary appeared to become stable and axisymmetric. Figure 10.7 shows the corresponding heat transfer results calculated from the time-dependent intensity ratio data along the centerline of the model. First, the intensity-ratio data was converted to temperature using a priori TSP calibration, and the heat transfer rate was calculated using a transient heat transfer model when the thermal properties of the coating were given. The heat transfer model was based on a solution of the 1D heat conduction equation for a semi-infinite layer. Note that some useful solutions of the heat conduction equation were given by Schultz and Jones (1973) for the determination of the heat transfer rate in short-duration tunnel testing. As shown by the thin line in Fig. 10.7, although the trend matched that of the gauge measurements, the values of the heat transfer rate obtained by this approach were over-predicted by 20 to 50%. This bias error might be due to the differences between a priori TSP calibration experiments and actual experiments (such as test set-up differences that led to spectral leakage, background illumination, etc.), and uncertainties associated with the thermal properties of the TSP and insulator. In-situ calibration with gauge measurements can account for this bias error. When the intensity ratio data was calibrated with the gauge data (thick line), excellent agreement was achieved. Besides the indented cone model, Hubner et al. (2001) also measured the temperature distributions on an elliptic cone lifting body in short-duration hypersonic flows. Recently, Matsumura et al. (2002) and Schneider et al. (2002) used TSP to detect heat transfer signatures induced by streamwise vortices shed from roughness elements on hypersonic models in the Ludwieg tubes.
|
Fig. 10.6. Time-dependent intensity-ratio measurements on the sharp-nose indented cone in the 48-in HST at Mach 11.0 and Re = 140,000 per meter. Images are shown at successive 1 ms intervals (actual acquisition rate was 2000 fps). From Hubner et al. (2002) |
|
Fig. 10.7. Centerline heat transfer flux distribution from Fig. 10.6. From Hubner et al. (2002) |
The experiments by Liu et al. (1994b, 1995b) and Hubner et al. (2002) indicate that the determination of the suitable thickness of an insulating layer (including TSP layer) applied to a metallic model is a key for successful quantitative heat transfer measurements using TSP in short-duration hypersonic tunnels. On one hand, when an insulating layer is too thick, the surface temperature may locally exceed the upper bound of the workable measurement range of TSP (typically 100°C for EuTTA-dope TSP and Ruthenium-based TSP) and even the melting temperature of a polymer layer. On the other hand, if an insulating layer is too thin (for example when TSP is directly applied to a metallic model), a change in the surface temperature is so small in a short duration that accurate recovery of the heat transfer rate is difficult. The appropriate thickness of an insulating layer can be estimated prior to tests based on a ID transient heat transfer analysis for a thin insulating layer on a semi-infinite body.
Thermographic phosphors have also been used for global heat transfer measurements in hypersonic wind tunnels at NASA Langley (Buck 1991; Merski 1999). Instead of metallic models, silica ceramic models fabricated using a special casting method were used. To coat models with phosphors in the form of powders, phosphors were suspended in a silica ceramic binder, and then the resulting mixture was applied to the model surface with an airbrush. The coating thickness was about 25 pm. The phosphor used at NASA Langley had a usable temperature range of 22-170°C, which was higher than the temperature range from -20 to 100°C for a polymer-based TSP like EuTTA in dope. Phosphors usually had several distinct emission spikes, typically two green spikes and a red spike in the emission spectrum under UV excitation. Therefore, a weighted two-color relative-intensity ratio could be used to determine temperature based on a priori calibration relation without using a wind-off reference image. In fact, this kind of thermographic phosphor was a two-color TSP. A three-color CCD camera was used to acquire red, green and blue images even though only red and green images were used for phosphor thermography. An estimated error in phosphor thermography was about 3oC over a temperature range of 22-170oC, and the total uncertainty in heat transfer measurements in typical hypersonic tunnels was less than 10%.
Liquid crystal (LC) thermography has been applied to heat transfer measurements in hypersonic flows (Jones and Hippensteele 1988; Babinsky and Edwards 1996). Compared to polymer-based TSPs and thermographic phosphors, thermochromic liquid crystals have a relatively narrow bandwidth of temperature sensitivity (typically 32-42oC). Currently, there are two implementation methods of LC for extracting quantitative heat transfer information. The first approach is to use LC with a very narrow bandwidth of about half a degree C. When a transient change in temperature occurs on a model surface during a run in a short-duration tunnel, temperature at which a single color of LC appears (usually yellow) is visualized most likely in a narrow strip or contour moving on the surface. The temporal evolution of the strip or contour with the specific temperature on the surface is recorded in a series of images, and then the heat transfer rate on the surface can be estimated based on certain transient heat transfer model. The instrumentation for the narrow-band approach is simple with a CCD video camera attached with a band-pass filter. The spatial resolution of measurement is limited by the frame rate of the camera. An alternative is the wide-band approach that utilizes the full range of colors (or hue) displayed by LC over a wider range of temperature, which allows global heat transfer mapping using a single image frame if the temperature-sensitive range of LC covers a temperature change experienced on the whole surface. Using this approach, Babinsky and Edwards (1996) obtained reasonable results of the heat transfer flux with the total uncertainty of 7% on a cylinder/15o-flare model in hypersonic flows. Note that the wide-band of LC (about 10oC) is, in fact, not wide compared to the usable temperature ranges of polymer-based TSPs and thermographic phosphors.


