The Design of Cascades for a Prescribed Chord wise Pressure Distribution
The lift, moment, and pressure distribution for airfoils in cascade can be predicted by conformal mapping or by methods similar to thin airfoil theory in which each foil is replaced by a vortex sheet. However, in the general case, both methods are difficult to apply.
It is possible under certain simplifying assumptions to calculate the mean flow through a cascade of airfoils with a prescribed pressure distribution. The mean streamline thus calculated approximates the shape of the camber line of the vanes to produce the prescribed pressure distribution. However, because of the finite number of blades, hence nonuniformities in the flow, the mean streamlines and vane camber lines differ by a small but significant amount. The purpose of this section is to calculate this difference by the
application of thin airfoil theory. The problem is reduced to an integral equation in the unknown vorticity distribution of the vanes, but because of its complexity only particular examples are evaluated.
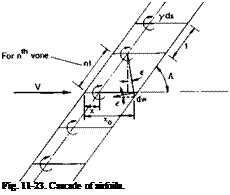 |
A cascade of airfoils is shown in Fig. 11-23. Consistent with thin airfoil theory, each airfoil is replaced by a distribution of vorticity y(x). Although, in general, each vane is cambered and at an angle of attack, a, relative to Vm, the vorticity is placed on periodically spaced straight lines parallel to Vm. Also, the boundary conditions that the velocity resulting from Vm and induced by the vorticity must be tangent to the vanes everywhere along their
cambered lines is satisfied only on the x-axis. Again, this is consistent with the linearized thin airfoil theory.
The downwash on the reference vane at a distance x0 due to an elemental vortex, у dx, located at x on the nth vane is
but
![]() x0 — x — nt cos A
x0 — x — nt cos A
r
r2 — (nt sin A)2 + (x0 — x — nt cos A)2.
Thus it follows that
In order that the mean camber line may be a boundary, or streamline, of the flow, the following must hold:
 (11-18)
where a is the angle of attack of the chord line of each vane and yc is the displacement of the camber line from the chord line. At this point, theoretically, the problem is solved, for if a, yc, Л, and t/c are given it should be possible to solve Eqs. (11-17) and (11-18) for y(x), hence the pressure distribution. Practically, the mechanics of solving the integral equation containing a doubly infinite series is quite involved, even for relatively simple cases. Instead of attempting to solve for y(x) for a given yc and a, a >>(x) distribution is assumed and the resulting yc is calculated. To make the problem tractable, the special case in which Л = тг/2 corresponding to Pm = 0 is studied. For this case Eqs. (11-17) and (11-18) become
 (11-19)
To evaluate this integral a change of variables is made:
 |
|
x = I (1 – cos в),
The doubly infinite sum appearing in Eq. (11-20) can be evaluated by contour integral methods. Let
and note that
but cot і в = — і coth в. Therefore
Substitution of the above into Eq. (11-20) gives the following:
 |
![]()
Substitution of Eqs. (11-23) into (11-22) gives
|
|
|
|||
|
|||||
where nc/t < 1.5.
For a given у-distribution the modification to м(ф) due to the cascade can be clearly identified in Eq. (11-24).
|
Consider now a cascade of airfoils with a у-distribution given by
у = X Лі sin пв. (11-25)
n=l
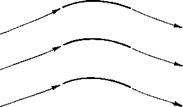
Because у vanishes at both 6 = 0 and n, it is obvious that the leading and trailing edges of the airfoil will become stagnation points that will result in a cascade of the form shown in Fig. 11-24.
Equation (11-16) is now substituted into (11-24). In addition, the following relations are used:
sin пв sin 6 = j[cos (n — 1)0 — cos (n + 1)0], (11-26)
sin (n — 1)0 — sin (и + 1)0 = —2 sin 0 cos и0, (11-27)
|
J |
‘K cos пв dd sin пф
0 cos 0 — cos ф sin ф
Equation (11-24) then becomes
Note, as one would expect, that for forward loading the slopes at the leading edges differ appreciably, whereas for aft loading it is the trailing edge slopes that differ the most.
In Ref. 8 a number of different cascades are analyzed. Starting with the measured pressure distribution, the mean streamlines are calculated and compared with the camber lines. The data is expressed in the form of A njl versus Pm, where, according to the notation of this section,
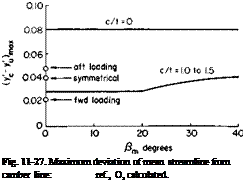 |
Part of Fig. 298 of Ref. 8 is given here as Fig. 11-27. Spotted on the figure are the results calculated for the three sample cases. It can be seen that,
according to the calculations, increases as the loading shifts aft
and that the experimental results fall in between the forward loading and the symmetrical loading case.
The values of (A«i//)max f°r l/t = 0 is readily verified by letting nc/lt = 0 in Eqs. (11-38) and (11-39). For this case
 Ус =
Ус =
У и =
Therefore
(Ус Уи)тах
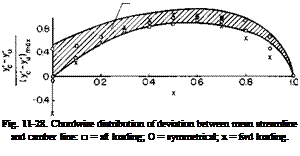
The chordwise distribution of Anjl is given in Fig. 11-28, and similar plots appear in Ref. 8 for different cascades. A general band is included in
Fig. 11-28 in which 75% of the data in Ref. 8 falls. It can be seen that the predicted trend is similar to the experimental trend with the symmetrical and aft loading distributions having the better agreement.
Observations and Conclusions. A solution for a cascade of airfoils, subject to the limitations of thin airfoil theory, has been obtained. Although the results are given only up to the second harmonic of the pressure distributions, they could easily be extended to include higher-order terms, at least for zero stagger angle and solidities less than one. Without too much difficulty, the results could be extended also to cover higher solidities by carrying through additional terms of Eq. (11-23).
The relationship between the vortex theory and the momentum considerations of the mean streamline can be seen if the spacing t is allowed to
approach 0 while keeping the vorticity per unit length along z finite. As t -> 0, let y/t = у’, nt = z.
Equation (11-17) then becomes
(x0 — x — z cos Pm)y'(x) dz dx
(z sin /U2 + (x0 – X – z cos pmf
 |
Since у is not a function of z, (11-17) can be integrated immediately with respect to z to give
The derivative of w(x0) with respect to x0 is then
|
(*o) = У'(*о) sin Л. |
 dw
dw
dx о
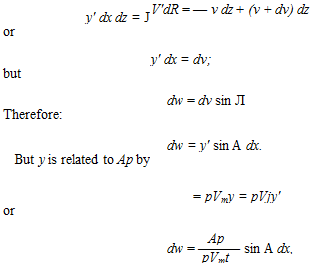
Equation (11-40) could be written almost immediately from consideration of the strength of the elemental vortex in Fig. 11-29.
 (11-41)
(11-42)
Equation (11-42) is the same result obtained by momentum considerations for the mean
/ A dx
flow resulting from distributing the vorticity of each vane uniformly in the z-direction.
We can now easily determine the cascade geometry to produce a desired pressure distribution. If the form of Ap is given by
Ap = jpV%,Cpf(x),
then
C
C, = — f(x) dx.
c Jo
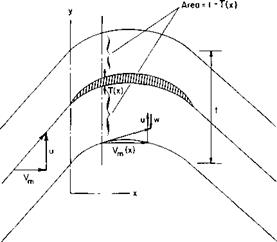
Given a desired turning angle в and choosing a solidity, we calculate Ct from Fig. 11-17 or Eqs. (11-12) and (11-13). Knowing Ct, Cp, and Ap(x) are then determined. The velocity w can next be calculated by integrating Eq. (11-42) from 0 to x. Referring to Fig. 11-30, the shape of the mean streamline can now be determined from the fact that
|
dyu и — и’ dx VJx) ’ |
(11-44) |
|
|
Vm{x) is determined from continuity by |
||
|
Vj = Vm(x)[t – T(x)], |
(11-45) |
|
|
where T(x) is the thickness of the vane in the у-direction. Having calculated yu(x) for the mean streamline and knowing C and C„ we calculate y’u from |
||
|
II – Э |
(11-46) |
|
|
The difference between the camber line and the mean dimensionless form, y’c — y’u, can be estimated from Fig. |
streamline in 11-26 or from |
|
Fig. 11-30. Construction of the mean streamline including the effect of vane thickness. |
Figs. 11-27 and 11-28, depending on whether the loading is symmetrical and more toward the leading or trailing edge. The shape of the camber line is then calculated from
y«(*) = l? u + (Ус – y’JlcC,. (11-47)
The attractiveness of the mean streamline method, devised by Wislicenus,
is the fact that most of the camber of the vane, in the form of the mean streamline, can be calculated by relatively simple momentum and continuity principles and only the small difference between the mean camber line and mean streamline needs to be estimated.
Problems
1. Calculate the cascade geometry to produce a turning angle of 90°, with Ap equal to a constant across each vane. Use a solidity of 1.93 and the thickness distribution of the vane in Fig. 11-22. How does the resulting vane compare with the illustration?
2. A jet of air 1 ft in diameter issues from a long straight duct with a velocity of 400 fps and with a density equal to that of air at standard sea-level conditions. What is the thrust produced by the jet? It now goes into a cylindrical duct with a bellmouth entry and a throat diameter of 4 ft. Assuming complete mixing, what is the thrust of the combination? Now the mixed flow goes into a diffuser with an exit diameter of 6 ft. What is the total thrust now? Finally, the diffused, mixed flow is turned 90° by a well-designed cascade. What is the vertical thrust?
3. Given a primary jet and two nozzles, and assuming that the mixing is
|
|
complete at the end of each nozzle, derive an expression for the augmentation ratio.


