Implications of the Scaling Parameters on the Aerodynamic Performance of Flapping Flexible Wings
The time-averaged force (CF) and the propulsive efficiency n could be related to the resultant force on the wing depending on the situation, such as fluid/inertial force, with/without free-stream, or thrust/lift/weight. The current result enables us to estimate the order of magnitude of the time-averaged force generation and and its efficiency for a flexible flapping wing using a priori known parameters.
Furthermore, the scaling can guide the design of flapping wing MAVs. For example, to support a given weight Wbody of a vehicle body in air, the scaling Eq. (4-36) reduces to
![]()
![]()
p 1r3.19 f2.38ф2.19с1.57 ps фа m
h038E019
m0.42g0.42h0.16 e0080
p0.42 о1.34ф0.92с0.66 ps фа m
assuming П1 > П0. The condition П1 > П0 is satisfied when f1 > f and simplifies the algebra; however, it poses constraints on the range of the structural properties, such that the natural frequency of the wing is higher than the motion frequency. Equation (4-48) shows that increasing either the wing area, motion frequency, or the flapping amplitude helps generate sufficient lift to sustain hovering flight. In contrast, by making the wing softer (i. e., reducing the Young’s modulus or wing thickness), wing deformations will increase, leading to higher lift generation. However, softening the wing further will violate the frequency ratio assumption, f1/ f > 1. The relation given for the flapping frequency is similar to that identified by Pennycuick [59]. Note that the wing weight is assumed to be negligible compared to the body weight in Eq. (4-48).
Another implication of the scaling is the interesting behavior of the role of h* for the chordwise flexible airfoil cases shown in Section 4.3.2. It was observed that the CtI increased first and then decreased with decreasing h*; see Figure 4.31. Using the current scaling, which is repeated as
1.17
consider first the situation that f1 > f, i. e., h* is not small. Then the denominator in
|
( |
k4 П I
4J5П – і ^ Пі, yielding
hence by reducing the thickness ratio, Пі ~ hf will decrease, leading to the observed enhanced [Ct). However, by decreasing h* further, the frequency ratio f1/f will be eventually of the same order of magnitude, resulting in different physical behavior. If, say f1/f = 0(1), but not in the resonance region, then the denominator in у will scale as П0 j 4^ П ^ « П0. Then, the resulting scaling will be
 |
 |
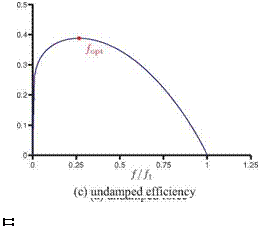
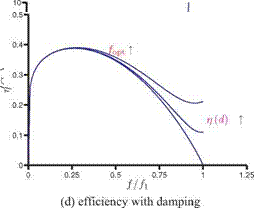
Figure 4.52. Force and propulsive efficiency plotted against the frequency ratio f/f1.
Sincen1 ~ hf and П0 ~ h,*, we have Ct) ~ h)183. This is consistent with the trend shown in Figure 4.31 that reducing the thickness ratio further will reduce the thrust.
Furthermore, for the thrust scaling for flapping flexible wings in water in forward motion, Eq. (4-37) can be rewritten as
1.17
and since St ~ ю, к ~ ю, and П0 ~ к2 ~ ю2, the thrust has a maximum at the resonance frequency. In reality, there is damping in the system, either structural or aerodynamic [456]. Although the effects of damping are not considered here, applying those effects for linear oscillators (e. g., [515]) yields the resonance frequency slightly below the natural frequency of the wing, with a finite value for the maximum relative wingtip deformation and hence the thrust: see Figure 4.52. In Figure 4.52b the effects of damping have been incorporated by approximating the denominator term as
|
Table 4.4. Optimal frequency ratios reported in the literature
|
where d is some small damping coefficient. This finding is consistent with the previous findings that the optimal propulsive performance is found near but slightly below the natural frequency of the wing [222] [453] [454] [508].
The propulsive efficiency scaling Eq. (4-47) can be rewritten in terms of the frequency ratio f/f1 as
|
|
which has a local maximum at f = 0.41f1. Depending on the scaling of the force, the optimal frequency can be found as
dj = 0 ^ f lopt =Ув-ї, (4-55)
where в is the exponent of у in the force scaling (i. e., 1.17 in Eq. (4-37) or 1.19 in Eq. (4-47), which yields the optimal frequency of 0.41 of the natural frequency. This indicates that the optimal efficiency is not achieved at the resonance frequency, but that the optimal frequency is some fraction of the natural frequency of the wing, which is also consistent with previous findings in the literature [453] [454] [492] [510] [516]; see Table 4.4. A cautionary note should be made, however, that Eq. (4-52) is derived from Eq. (4-36) and assumes f / f1 < 1. Hence, strictly speaking, the conclusion that the maximum force is generated at the resonance frequency is not valid. The revised scaling proposed by Kang and Shyy [404] by considering hovering flexible flat plates cases with frequency ratios up to 0.8 would yield the frequency ratio of 0.6 without including the effects of damping.
Figure 4.52c depicts Eq. (4-55) as a function of the frequency ratio and shows that the propulsive efficiency increases with the increasing frequency ratio until reaching the optimal efficiency, and then it drops to zero at the resonance frequency. Since the undamped linear oscillator is unable to represent the resonance behavior correctly, an arbitrary damping has to be included in the system as before. Figure 4.52b shows the effects of including damping, where d is taken to be 0.0,0.2, and 0.4: the optimal frequency ratio increases with increasing d, as does the efficiency at the resonance frequency. Note also the similarity between Figure 4.52b and the computed propulsive efficiency curves shown in Figure 4.48. A qualitative comparison with the measurements reported in Ramananarivo, Godoy-Diana, and Thiria [454] shows that, although the precise details differ, the overall qualitative trend is similar.
For example, for a 2 percent thickness wing with a rectangular planform made of aluminum hovering in air, the optimal frequency of the flapping motion is 5.4 Hz
Table 4.5. Summary of the proposed scaling
![]()
![Подпись: Force 119 Efficiency в3у117 Source: [351].](/img/3131/image520_2.gif) |
|||||||
Forward locomotion, water
when the wing has a chord length of 20 cm and span of 50 cm with a flapping amplitude of 30°. Scaling down the geometry of the wing 10 times to the chord length of 2 cm and span of 5 cm, and keeping the aspect ratio the same, the optimal flapping frequency increases to 54 Hz. The resulting propulsive force coefficient and the propulsive efficiency remain the same for both cases. However, the dimensional propulsive force and the power required are 100 times smaller for the smaller sized wing, proportional to the square of the chord. Yet, for the same aspect ratio and thickness ratio, the volume of the wing is proportional to the cubic power of the chord. Consequently, for the same material, the mass of the smaller wing is 1,000 times smaller. The current scaling shows, consistent with Shyy et al. [245], that smaller flyers need to flap faster from the efficiency point of view, but their relative payload capacity increases because their weight reduces at a much faster rate compared to larger flyers.
Finally, the scaling parameters for diverse flow and kinematics conditions are summarized in Table 4.5. For forward flight in water, the effective stiffness Пх, the normalized plunge amplitude h*a, the mass ratio p. s = pha/(pshs), and the frequency ratio f/f1 dictate the propulsive force and the efficiency. For hovering in air, for the studied kinematics, the role of the mass ratio is taken over by the factor p*h*a = p, s/h* . Determining the efficiency for the hovering motion in air is left to future work in this study, and the resulting scaling is only predicted by following the same argument as for the propulsive efficiency in forward flight in air. Notice that the factor p*h*a = pha/(pscm) is much smaller than ps = pha/(pshs), resulting in a much lower propulsion for the hovering symmetric flap/plunge motion in air, since the thickness ratio is usually only of the order of 0.01. This order estimation matches well with the values shown in Ramananarivo, Godoy-Diana, and Thiria [454]. For the hovering Zimmerman wing the ratio between the propulsive force CL and the force required for input power, CT, was of the order of h*. This scaling suggests that insects may require different mechanisms, such as active or passive pitching motion with a reinforced leading edge, which is commonly observed in many insect wings (see Fig. 4.4). Furthermore, non-symmetric motions, such as figure-of-eight motion (see Fig. 1.11) where the wing experiences forward motion, may yield higher efficiency [517].


