Category Aircraft Flight

Ultra-high by-pass (UHB) engines, prop-fans and unducted fans

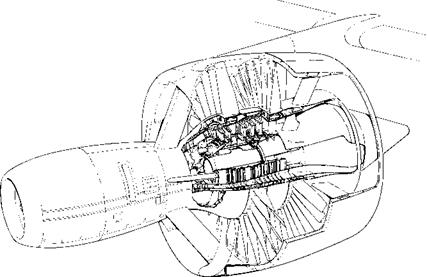
In the quest for improved efficiency, engines with much larger by-pass ratios than the early turbo-fans have been designed. Both ducted and unducted designs have been devised, and examples are illustrated schematically in Fig. 6.27. In some of the designs a gearbox is incorporated in order to reduce rotational, and hence, blade tip speed. Contra-rotating fans are normally used.

There is no standard classification of such engines, and the term ‘prop-fan’ is used loosely to describe various different types. There is also something of a grey area in terms of whether a design should be classified as an unducted fan, or simply an advanced propeller.

The major problem with very high by-pass ratio engines, is the noise that their supersonic blade tips produce. Rear mounting of the engines can reduce the cabin noise and noise-induced structural fatigue. It also eliminates the pos­sibility of the pressurised fuselage being punctured in the event of a blade shear­ing off. Unfortunately, from practical considerations, rear mounting limits the number of engines to two, or possibly three.

For really large transatlantic aircraft, four engines are normally preferred, and in this case, wing mounting must be used. The ducted design shown in Figs 6.27(c) and 6.28 is intended for use on such aircraft, cruising at high sub­sonic Mach numbers. The reduced intake Mach number that can be obtained

Ultra-high by-pass (UHB) engines, prop-fans and unducted fans

Fig. 6.28 The Rolls-Royce contra-rotating very high by-pass fan concept. No gearbox is used, and the fan blades are connected directly to contra-rotating turbines

Ultra-high by-pass (UHB) engines, prop-fans and unducted fans

Fig. 6.29 Unducted fan propulsion

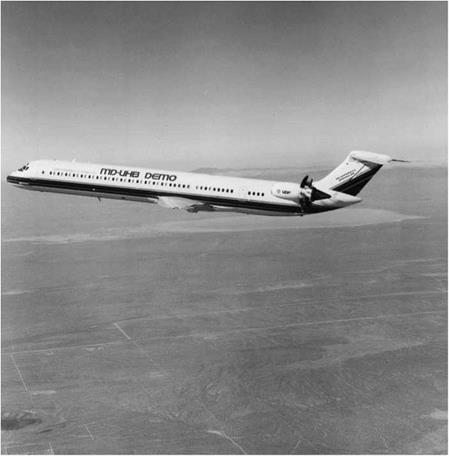
The Macdonnell-Douglas MD-80 unducted fan demonstrator aircraft fitted with the gearless General Electric UDF® engine; front-runner in the race to develop this type of powerplant. Dispensing with the gearbox considerably reduces the weight and mechanical complexity of the engine (Photo courtesy of General Electric Co.)

with a duct is an advantage for flight at such Mach numbers, as explained earlier. The duct also affords some noise shielding and containment in the event of shedding a blade.

For twin-engined transports and for cruise Mach numbers up to 0.86, the even higher-efficiency unducted designs are preferable. Figure 6.29 shows the General Electric gearless unducted fan (UDF®) installed in the MD-80/UDF demonstrator, where it has shown exceptionally low fuel consumption and low community noise, as well as a cabin environment equal to or better than today’s turbo-fans. Its commercial success still needs to be demonstrated.

Ultra-high by-pass (UHB) engines, prop-fans and unducted fans Ultra-high by-pass (UHB) engines, prop-fans and unducted fans
Ultra-high by-pass (UHB) engines, prop-fans and unducted fans

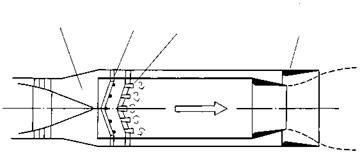
Ultra-high by-pass (UHB) engines, prop-fans and unducted fansFig. 6.30 A reheat chamber or afterburner

The exhaust from a gas turbine still contains a large proportion of oxygen which can be used for burning additional fuel in the reheat chamber. This can produce a considerable amount of extra thrust

Reheat is often used for take-off on combat aircraft with high wing loadings. It is also used at high supersonic speeds, and for rapid acceleration and climb

Planforms for supersonic flight

So far we have only looked at the effect of the aerofoil cross-sectional shape on the aerodynamic performance of the lifting surface. We know that in subsonic flight the planform shape has a vital role to play, and the same is true above the speed of sound.

The unswept wing

Let us first take a look at the unswept wing. We have already seen what the flow is like when we consider a two-dimensional section and ignore any

3-dimensional flow at wing tip

Intersection of wing surface and tip Mach cone

Wing trailing edge

Shock wave

Mach cone

Curved shock wave

Fig. 8.7 Wing-tip effect in supersonic flow (unswept wing)

influence from the tips. Let us now consider the more realistic situation in which the wing has a finite span so that the tips will have an influence on the wing behaviour.

When we considered subsonic wings (Chapter 2) we saw how the tip affected the flow everywhere. In a supersonic flow we found (Chapter 5) that because of the way pressure disturbances are propagated, only a limited region of the flow can be affected by the presence of an object. Thus we find that the influence of the tips is restricted to a limited region and the centre section of the wing behaves in a purely ‘two-dimensional’ way as though the tips were not there at all.

The region over which pressure disturbances from the tip can propagate will be bounded by the ‘Mach cone’ (Fig. 8.7). The Mach lines making up the surface of this cone are determined by the local flow conditions at each point along their length. Thus, in general, the local slope of the Mach line, and consequently that of the surface of the Mach cone, will vary and the surface will be warped slightly. Further the geometry of the cone will also depend on the wing incidence. In the centre region, outside the tip Mach cones, the flow knows nothing about the existence of the tip region and the flow is the straightforward two-dimensional flow discussed earlier.

Further from the surface the tip Mach cone intersects the oblique bow shock wave generated by the wing centre section (Fig. 8.7). The shock is therefore

Fig. 8.8 Unswept wing for supersonic flight

In supersonic flight the unswept wing of the F-104 is relatively efficient, but in subsonic flight, the highly loaded razor-thin wing gives poor handling, and a high stall speed. Like the Lightning, it was designed as a high performance interceptor at a time when almost total reliance was placed on air-to-air missiles. Manoeuvrability and dog-fight capability were considered of little importance (Photo by N. Cogger)

altered in the tip region and the outer region of the tip flow becomes bounded by a conical shock wave as shown in the figure.

Because the tip can influence the flow within its Mach cone, the flow in this region develops a spanwise component which is absent in the two-dimensional centre region of the wing. This spanwise velocity results in a circulation around the tip from the high-pressure lower surface to the low-pressure upper surface. Trailing vortices are thus formed in a manner similar to a subsonic wing.

If the wing is unswept a sharp leading edge is required to reduce the wave drag and, since such wing sections have poor low speed performance, they are not employed when this aspect is important. Figure 8.8 shows the F-104, one aircraft where such a planform was employed for high speed.

Swept wings

In Chapter 2 we saw how wing sweep could be used to reduce the component of velocity approaching at right angles to the wing leading edge. If the wing is

swept back sufficiently to make this velocity component less than the velocity of sound then the wing will behave as though in a subsonic air stream.

In order to simplify the discussion we will return to the consideration of a wing of infinite span. In this way we can initially ignore both the problem of the wing tip and that of the ‘cranked’ centre section of the wing.

Servo-tabs and trim tabs

Another means of reducing the load required is to use a servo-tab, as illustrated in Fig. 10.18. Deflection of the tab downwards causes the trailing edge of the surface to lift, producing a large turning moment in the primary control surface. Various means of coupling the tab and primary surface were devised, but such arrangements are now largely obsolete. Kermode (2006) describes the historical development of tabs.

Nowadays tabs are normally used primarily for trimming the control sur­faces; that is, setting them so that the control surface produces just the right amount of force to keep the aircraft flying steadily, hands-off. Such trim tabs are controlled by a separate trim wheel in the cockpit or flight deck, and are actuated independently of the main surface actuating system. Trim tabs allow

Fig. 10.17 External mass-balance weights were used on the tail of the Venom

Fig. 10.18 A servo-tab

Downward deflection of the tab increases the lift on the main control surface causing it to deflect upwards

The force required to operate the tab is considerably less than that which would be needed to operate the main control surface directly

an aircraft to be flown virtually, or even literally, hands-off, for much of the time. Tabs may be seen in Fig. 10.19. Fixed trim tabs, in the form of small strips of metal affixed to the trailing edge, may sometimes be used, their pur­pose being to ‘tune’ the control surfaces to give a good balance.

Movable trim tabs can provide restricted emergency control in the case of a failure in the primary control surface system, but this is not an airworthiness requirement.

Fig. 10.19 Tabs fitted on elevators and rudder of an old Catalina flying boat

Roll damping

The first of the commonly encountered lateral motions that we will consider is not oscillatory in nature at all. This motion takes place when the aircraft is given a disturbance which causes it to have a rate of roll.

In order to simplify the argument we will suppose the motion to be relatively rapid and purely in roll, so that no significant sideslip or rate of turn has time to develop.

The first thing to notice is that the roll itself will produce no restoring moment because of the new position of the aircraft (Chapter 11). The motion is therefore neutrally stable as far as the static stability is concerned. There is however a rolling moment which is caused by the rate of roll, or rolling velocity. This moment arises because the downgoing wing has its angle of attack effectively increased, while the angle of attack of the upgoing wing is correspondingly reduced, as is shown in (Fig. 12.8). This causes a change in lift on the two wings which results in a moment which opposes the rolling motion.

The magnitude of the moment is dependent on the rate of roll and, as it opposes the motion, damps it out. The damping caused by this effect is strong and the ‘roll damping’ of most aircraft is high.

Rolling

Aircraft with a very low aspect ratio, such as Concorde, will, in general, have a much lower roll damping than a conventional aircraft because of the proportionally reduced span.

Moving aircraft and moving air

Before we begin our description of the generation of lift, it is necessary to establish an important fact, which is, that if air is blown at a certain speed past a stationary aircraft, as for example in a wind-tunnel, the aerodynamic forces produced are identical to those obtained when the aircraft flies through stationary air at the same speed. In other words, it is the relative speed between the air and the aircraft that matters. This is fortunate, because it is generally much easier to understand and describe what happens when air blows past a fixed object, than when a moving object flies through still air.

Moving aircraft and moving air

Fig. 1.4 Inclined surfaces

Flat or symmetrical sections will generate lift if inclined to the flow direction

Disadvantages of swept wings

On a swept wing, only the normal component of velocity changes, and thus pressure changes are produced only by this component. A swept wing flying at a speed V, therefore, behaves like a straight wing flying at a lower speed; roughly V x cosine of sweep angle. Thus, we can see that wing sweep reduces the amount of lift produced for a given flight speed, wing area and angle of attack. Correspondingly, to give the same amount of lift as an unswept wing, the swept wing will need to be larger, and consequently heavier.

Although the lift is dependent on the normal component of velocity, both components contribute to the drag. The swept wing, therefore, tends to have a poorer ratio of lift to drag than an equivalent straight wing.

Swept wings and straight wings are influenced differently by the downwash effect of the trailing vorticity. We can explain this by use of the Lanchester – Prandtl vortex line model. Referring to Fig. 2.19 we see that an inboard line of trailing vorticity starting at A, will have more effect at C, than an equal strength outboard line starting at B. The nearest part of the outboard line is simply further away than that of the inboard line. On an unswept wing, both lines would have an equal and opposite effect. By considering the direction of rotation, we see that the inboard line tends to produce an upwash at C, while the outboard line produces a downwash.

On an unswept untapered wing, the upwash effect of inboard vortex lines is more than cancelled by the downwash produced by the large number of lines concentrated near the tip. On a swept untapered wing, the stronger influence of the inboard lines has the effect that the downwash decreases towards the tips. This is compounded by the fact that on a swept-wing configuration, the bound vorticity on one wing produces a downwash effect on the other. The mutual interference effect will again tend to produce a greater downwash at the centre than at the tips.

On a tapered swept wing, the trailing vorticity is less concentrated towards the tips, so the outboard downwash is further reduced. In fact, there can even be an upwash at the tips.

The upwash or reduction in downwash at the tips produces problems, since, when the wing approaches the stalling angle, the tips tend to stall first, giving the undesirable effects described earlier. On a swept-wing aircraft, the effect of tip stall is particularly serious. As the tips lose lift, the centre of lift will move

Disadvantages of swept wings

Fig. 2.19 The influence of wing sweep on downwash

A vortex filament trailing from A will have a stronger influence on the flow at the tip than a filament of similar strength starting at B will have on the inboard section. The upstream influence of a trailing vortex is relatively weak

forwards, causing the aircraft to pitch nose-up, thereby increasing the stall in a runaway manner. The problem of tip stall was encountered on many early swept-wing aircraft. One solution is to sweep the wing forward, as described in Chapter 9.

Figure 2.20 shows what happens on a simple swept wing at high angles of attack. A separated conical vortex starts to form. On highly swept wings this vortex more or less follows the line of the leading edge, but on moderately swept wings, it bends away inboard. The tips produce very little lift, and any control surfaces near the tips become ineffective. There may be little or no loss in overall lift, however, since the separated vortices produce a contribution to lift, as we described in the previous chapter.

The problems encountered on early swept-wing aircraft were primarily those of loss of stability and control. In later chapters, we show how improvements in wing design, and advances in control systems have largely overcome such difficulties.

Disadvantages of swept wings

Fig. 2.20 Leading edge vortices form over a swept wing at high angles of attack. Towards the tips they tend to curve inboard. They are not stable in position

Swept wings only show an advantage for aircraft designed to fly close to or above the speed of sound. For low speed aircraft, they have positive dis­advantages, as outlined above, and it would be a mistake to introduce wing sweep for purely aesthetic reasons. A small amount of sweep is sometimes used on low speed aircraft purely to enable the wing spars to enter or attach to the fuselage at a structurally convenient position.

Wing sweep is also used as a means of providing stability in tailless designs, as we shall show later.

Low-drag aerofoil characteristics

Although aerofoils of the NACA 6-series, mentioned above, have now largely been replaced by more modern designs, it is worth looking at them in some detail, because a considerable amount of experimental data has been acquired for them. The conclusions that can be drawn are generally applicable to other families of aerofoils.

Figure 4.6 shows the lift and drag coefficient curves for two aerofoils of this type. It will be seen that there is a short central dip or ‘bucket’ shape in the drag curve. This represents the conditions where the desired laminar boundary layer occurs, giving low drag. For efficient cruising, the wing section must be operated in the ‘bucket’ region.

As with other NACA aerofoil families, the designation number of 6-series aerofoils gives the most important features in coded form. The system of coding is complicated, but is described by Abbott and von Doenhoff (1949), who also give details of earlier series NACA sections.

Low-drag aerofoil characteristics

Подпись:

In the example given in Fig. 4.5(b), the second number indicates that a favourable pressure gradient on the upper surface exists up to 5 tenths of the chord, i. e. half way along. This is near the position of maximum thickness. The normal range for this position is between 3 and 6 tenths of the wing chord. Moving the position of maximum thickness rearward reduces the value of the minimum drag coefficient, but narrows the range of angle of attack over which low-drag laminar flow can be maintained. It also reduces the maximum lift coefficient that can be obtained, as a long region of unfavourable pressure gradient develops at high angles of attack.

Because of the restricted range of efficient operating conditions, and prac­tical difficulties in maintaining laminar flow over a large proportion of the surface, aerofoils with the maximum thickness point aft of about 50 per cent are only suitable for rather specialised applications.

A whole family of aerofoils having the same basic profile, but with different ratios of maximum thickness to chord, can be drawn. The last two figures in the NACA code indicate the percentage thickness-to-chord ratio.

Reducing the thickness-to-chord ratio has a similar effect to moving the maximum thickness point rearwards. The minimum drag coefficient falls with decreasing thickness, but the maximum lift coefficient is reduced, together with the width of the low-drag laminar bucket.

From Fig. 4.7, it is easy to see why the latter two effects occur. For a thin aerofoil, once the angle of attack is increased by more than a few degrees, the region of favourable pressure gradient on the upper surface decreases rapidly, with a consequential reduction in the proportion of laminar boundary layer. At high angles of attack, the thin nose is likely to provoke leading-edge separation.

Low-drag aerofoil characteristics

Fig. 4.7 Effect of thickness

A 12 per cent thick NACA 63,-412, and a 6 per cent thick NACA 66-006 section at 8° incidence

On the thin section, the unfavourable pressure gradient starts almost at the nose, and the section is on the point of stalling. The thicker cambered section stalls at around 15°

Thick aerofoils thus give a bigger range of low-drag operating conditions, with improved maximum lift coefficient, but at the expense of a slightly increased minimum drag coefficient. The thicker aerofoil also allows deeper spars to be used, with a consequential saving in weight.

The design lift coefficient for this type of section is the value of lift coefficient that corresponds to the middle of the low-drag laminar bucket in the CL to CD curve (Fig. 4.6). The design lift coefficient can be changed by altering the camber. A cambered profile is simply a ‘bent’ version of the basic symmetrical shape. Increasing the camber increases the design value of CL, and maximum CL, and slightly increases the drag coefficient. Increasing the camber also has a destabilising effect, as we shall see later.

For a symmetrical section, the minimum drag coefficient occurs at zero angle of attack, which makes such aerofoils suitable for use on tail surfaces which are required to produce very little lift in level flight.

On earlier wing sections, the shape of the mean line (the camber line) had no real theoretical basis, and a simple mathematical function was used to draw a smooth curve. On nearly all early aerofoils, most of the lift force was con­centrated well forward when operating at the design angle of attack. Because a theoretical design method was used for the NACA 6-series aerofoils, it became possible to derive mean lines (camber lines) that would give any desired chord – wise lift force distribution, at a specified angle of attack. In particular, it is possible to use a mean line that gives a nearly constant chordwise distribution of lift at the design lift coefficient. As we shall see later, this is useful for aircraft that fly at high subsonic speeds.

The theoretical method used for the 6-series aerofoils was based on inviscid (no viscosity) flow theory. The effects of viscosity were allowed for by using boundary layer theory, but before the introduction of computers, the accur­acy of the procedures was limited, and they were slow and extremely tedious. The aerofoils did not behave exactly as predicted, and had to be carefully tested.

The use of computer-based numerical analysis has produced improved theoretical design procedures, which have led to the development of new gen­erations of aerofoil sections, both for low speed and high speed flight. These aerofoils have generally better characteristics than the earlier 6-series sections, in terms of low drag, and range of operating conditions. Figure 4.8 shows a newer general purpose aerofoil, the NASA LS(1)-0417 (originally designated GA(W)-1), described in detail by McGhee and Beasley (1973). This section has a maximum CL value greater than 2, which is roughly 50 per cent greater than

Low-drag aerofoil characteristics

Fig. 4.8 NASA LS(1)-0417 aerofoil intended for general aviation use

A modern aerofoil giving a high maximum CL and a good lift to drag ratio despite a thickness-to-chord ratio of 17 per cent

Low-drag aerofoil characteristics

Fig. 4.9 Low-drag features on the Optica included end-plate effect on the tail, and a modern low-drag wing section

for the equivalent 6-series aerofoil. It has a maximum ratio of lift to drag of around 85. The section has been used on a number of small aircraft, including the Piper Tomahawk, and the Optica, shown in Fig. 4.9.

For transonic aircraft, the wing section geometry is strongly influenced by consideration of the effects of compressibility, and this leads to rather different aerofoil shapes, as described in Chapter 9.

It is important to realise that CL and CD curves such as those given in Fig. 4.6 only apply to two-dimensional sections. The CD values take no account of the trailing vortex drag that occurs on a complete wing. A section that achieves its minimum two-dimensional CD value at a high CL may produce a large overall wing CD because of the contribution due to trailing vortex drag. It should also be noted, that CL and CD values may vary significantly with Reynolds number, and many of the older sections were only tested at relatively low Reynolds numbers.
Constant-speed propellers

Both reciprocating and gas-turbine engines generate maximum power at a rota­tional speed that is close to the limit imposed by mechanical and temperature considerations. Maximum efficiency is also usually obtained at a high rotational

speed. Changing the engine speed wastes fuel, and thus, it is desirable to run the engine at an optimum constant speed, independent of flight speed. The actual engine speed selected depends on the flight conditions required. Normally, near-maximum speed is required to produce high power for take-off and initial climb, with lower settings being used for cruising or other flight conditions, in order to prevent overheating or overstressing the engine.

With propeller propulsion, such constant-speed operation can be obtained by employing a mechanism that automatically adjusts the blade pitch angle to alter the aerodynamic resistance torque. If an increase in speed is sensed, the pitch is made more coarse to increase the resistance torque. The speed (rev/min) setting can be altered by the pilot by means of a selector level. Nowadays, such constant-speed propellers are fitted even to quite unsophisticated aircraft.

Further improvements in efficiency can be obtained by linking the pitch control mechanism to the engine control system, so as to give a carefully pro­grammed match.

Speed and altitude measurement

So far when we have used the term ‘speed’ we have meant the relative speed between the aircraft and the air. This quantity is known as the ‘true air speed’.

The most common way of measuring the air speed is to use pressure differ­ences generated by the motion. Such a pressure difference can be obtained by taking one tapping at a stagnation point, where the air is brought to rest relative to the aircraft, and a second tapping at a point on the surface of the aircraft where the local pressure is equal to that in the surrounding atmosphere (Fig. 7.2). Bernoulli’s equation (Chapter 1) tells us that this pressure difference will be equal to – pV2 (where p is the air density and V is the speed of the air

Pitot probe (one each side) —

flow is stopped

pressure

Fig. 7.2 Air speed measurement

‘Indicated’ air speed is derived from the difference between pitot and static pressures stream). Thus, provided we know the density, we can calculate the speed of the air stream from the measured pressure difference.

In principle it would be possible to find the local density by measuring atmospheric temperature and pressure, but for historical and practical reasons this is not normally done. Instead the density is assumed to be the sea level value in the standard atmosphere (1.226 kg/m3). The air speed calculated from the measured pressure difference, using this constant density value, is called the Equivalent Air Speed (EAS).

As we have seen, the real value of the density will vary with location, weather and altitude so that the equivalent air speed will be coincident with the true air speed only at sea level under standard conditions. As the height increases so the actual density reduces and the equivalent air speed falls below the true air speed.

Although this may appear at first sight to be a grave disadvantage, as far as the practical task of flying the aircraft is concerned this is not so. For example the pilot needs to know when he is in danger of stalling the aircraft. In Chapter 1 we saw that the aerodynamic forces acting on the aircraft are proportional to the dynamic pressure (-pV2). If the aircraft is slowed, the lift is kept equal to the aircraft weight by increasing the angle of attack to compensate for the loss of dynamic pressure. Since the dynamic pressure and equivalent air speed are directly related, the stalling angle of attack will occur at a particular equivalent air speed rather than true air speed.

If the pilot had to work in terms of true air speed, the air speed reading at stall would depend both on the height and the weather conditions at the time; not very convenient for a pilot trying to make quick decisions!

The detailed flow-field around the aircraft will be changed by such factors as the attitude of the aircraft and whether such devices as flaps are deployed. These changes in the flow-field will have some influence on the two pressure tappings used to measure the air speed. This will mean that there will be errors (called position errors) in the equivalent air speed presented to the pilot on his Air Speed Indicator (ASI). The actual ASI reading therefore differs slightly from the equivalent air speed and is known as the Indicated Air Speed (IAS).

Fortunately these position errors will at least be the same for a given set of flight conditions. Thus, although the indicated air speed shown on the ASI differs slightly from the position-error-free equivalent air speed, stalling will always occur at the same ASI reading, which is all the pilot requires.

From the point of view of navigation the indicated air speed given by the ASI is of limited use, although in simple light aircraft this may be the only avail­able information regarding speed. In this case the pilot will have to estimate the actual speed relative to the ground from his knowledge of altitude and prevailing wind speed. In more complex aircraft a variety of navigational aids is available which are either based on ground-based transmitters GPS or, for inertial navigators, may be self-contained within the aircraft.

In Chapter 5 we saw that the Mach number is of great importance at high speeds, and this will become even more apparent in Chapters 8 and 9. In such aircraft a Mach meter is fitted.

The other important quantity that the pilot needs to know is the altitude of the aircraft. Traditionally this too is derived from a pressure measurement. This time it is the static, or local atmospheric pressure which is required. As we saw at the beginning of the chapter, this static pressure will vary with height. The pressure measurement is not all that is needed to obtain the true height because the local static pressure will depend on the local weather conditions as well as the height. The altimeter is thus calibrated assuming that the atmosphere has the characteristics defined for the International Standard Atmosphere (ISA) (Fig. 7.1).

The reading obtained on the altimeter with this ISA assumption is known as the pressure height. As far as the pilot is concerned the main problem occurs during landing when the pressure height may not correspond to the actual height of the airfield at which the landing is to be made. For this reason the altimeter reading can be adjusted so that the correct indication will be obtained at the airfield. This is done by the pilot immediately prior to landing in response to information supplied by the controllers on the ground. Because the altitude is derived from the static pressure measurement, it too is subject to position error.

On most military and commercial aircraft other means of altitude measure­ment are generally supplied in addition to the pressure altimeter. These radio altimeters are based on the reflection of radio waves from the ground and are not subject to the errors detailed above. GPS systems are also now used.

The instruments we have described above are used by the pilot to give him information relating to the aerodynamic performance of the aircraft, and are known as primary flight instruments. Another instrument which falls into this category is the rate of climb indicator. Yet another is the artificial horizon which gives the pilot information about the attitude of the aircraft with respect to the ground. This instrument relies on a gyroscope to provide a stable refer­ence. Figure 10.2 shows the instrument panel of a typical modern light aircraft.

‘Shuttle’ type vehicles

It was the need for a more economical system, which could be used for placing objects into earth orbit and land on a conventional runway which led to the development of the Space Shuttle (Fig. 8.19). This vehicle was launched by a booster rocket and injected into orbit by its own rocket engines. During re-entry it was successively a hypersonic, supersonic, transonic and subsonic glider.

If we examine the aerodynamic characteristics of the shuttle, we find that the lifting surface was a slender delta configuration which had a great deal in common with Concorde’s wing. We have already seen that this type of wing behaves in a progressive and satisfactory manner from subsonic to supersonic speeds. It is, in fact, the landing requirement which was mainly responsible for the overall size of the shuttle wing.

We have already seen (Chapter 1) how separation is used to good effect on this type of wing to produce a pair of well-ordered vortices on the top surface over a large range of incidence. If the angle of attack is increased to extreme values there is a progressive breakdown in the vortex structure until the con­ventional disordered separated wake is obtained. This flow condition is not desirable on a supersonic passenger transport because of the large amount of drag involved. No such economical restriction applies to the re-entry case, though, and it is this flow regime which was used during a large proportion of the hypersonic phase of re-entry.

The provision of substantial amounts of lift enabled flight profiles to be chosen which considerably alleviated the heating problems associated with re­entry. An ablative shield was not required and instead ceramic tiles were used to insulate critical parts of the structure.

The shuttle was placed into orbit using a booster rocket and the shuttle itself formed the second stage of the launch vehicle. In general two stages are always needed to inject a payload into earth orbit if conventional rocket propulsion is used. Thus expensive recovery and refurbishment of the first stage is required and in addition, although a runway can be used for landing, it is necessary to provide a launch gantry and attendant services at the commencement of the mission. From an economical point of view the attraction of a single stage vehicle which can both take off and land from a runway and still inject a payload into earth orbit is obvious.