Category Helicopter Test and Evaluation

Ceiling climb tests

The variation in rate of climb with altitude and/or AUM in forward flight can be used to generate a range of climb schedules: for best rate of climb, for best angle of climb or minimum time to height. Consequently, it is often necessary to validate these schedules during a series of ceiling climbs. In addition to determining if the expected performance is realized, these tests are also used to establish whether any modification to the schedule is required for handling reasons.

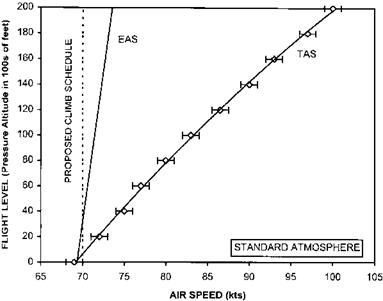
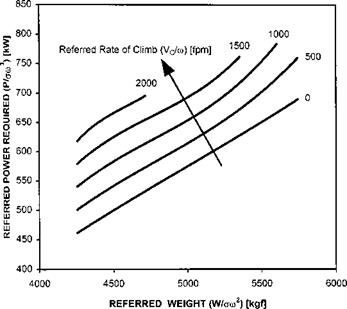
Using a climb schedule, such as that shown in Fig. 3.35, a sustained climb is made to the maximum permitted altitude or the service ceiling (defined as ROC = 100 ft/ min), whichever is the lower. Data is recorded at periodic intervals based on height achieved and includes: [3]

image75

image76

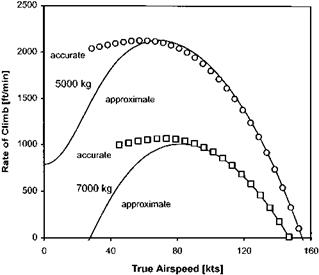
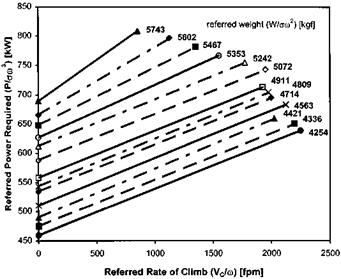
Fig. 3.34 Variation of climb performance with mass.

image77

Fig. 3.35 Derived climb schedule.

• Indicated rate of climb;

• Power parameter (torque or collective pitch);

• Engine speed and temperature;

• Rotor speed;

• Control positions;

• Vibration.

At low altitudes height intervals of 1000 ft are commonly used. The interval reduces to every 500 ft and then every 200 ft or even every 100 ft as the excess power diminishes.

Measuring climb performance

In the case of partial climbs ground effect is not considered and the parameter m/f Q cannot be controlled since the outside air temperature changes as the rotorcraft climbs. Therefore, the familiar power required relationship can be written as:

V = J_P. W V

m 8 VQ, 5 , m)

V = J_P_ _W Л m lam3 ’ cm2’ m I

The equations can be re-written in an alternative form introducing a power-to- weight ratio:

V = f(_L_ W Л

m WVQ ’ 5 , m)

V = J_P_ _W Л

m Wm’ am2’ m I

3.6.1 Flight test techniques

The main problem with using an ‘experimental’ approach to reducing climb perfor­mance data is the difficulty associated with maintaining the relevant referred parameters constant. It is therefore common practice to use test day conditions and refer the data afterwards, if required, rather than target specific combinations of referred parameters during the testing itself. There are two techniques that may be adopted to minimize the effect of reducing aircraft mass on the measured climb performance:

• Mean-all-up-mass method;

• Constant mean altitude and power/weight ratio method.

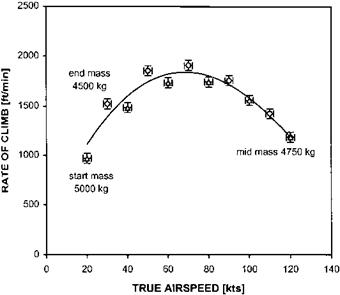
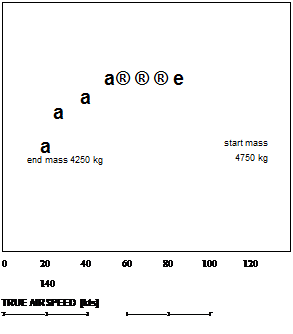
The mean-all-up-mass method involves documenting the rate of climb through the same altitude band (typically 1000 ft) with the test airspeeds being flown in a particular order. Starting with the lowest, the test airspeeds are progressively increased up to the maximum then progressively reducing intermediate speeds are evaluated back down to the minimum, see Fig. 3.30. A mean line drawn between two curves, corresponding to the test points from minimum to maximum and vice-versa represents the climb performance for a mass equal to the average for a complete run.

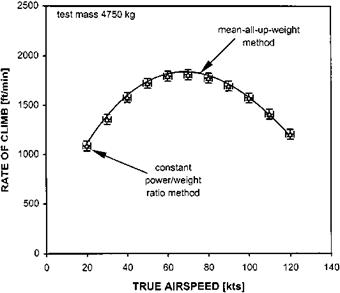
The constant power/weight ratio method is slightly different. Although the altitude band remains the same, as with the previous method, the power (or torque) is reduced progressively as fuel is burnt to maintain the power/weight ratio constant. The test speed is changed progressively from minimum to maximum or vice-versa, see Fig. 3.31. Figure 3.32 compares the results obtained using both methods. Note the similarity in the curve fit obtained.

As in other tests that involve measurement of the vertical speed, it is common practice to determine the rate of climb by documenting incremental altitude and

image73

Fig. 3.30 Climb performance – mean-all-up-weight method.


Подпись:2500

2000

c

Ё

i. 1500

CD

s

Z]

о

0 1000

ш

1

500

Подпись: о
Fig. 3.31 Climb performance – constant power/weight ratio method.

elapsed time. Charts of altitude versus time are plotted for each speed tested and used to obtain a smoothed rate of climb by means of a straight-line fit. This process compensates for data scatter and highlights any non-linearities associated with the helicopter drifting away from trim. An analogous process can also be used to determine

image74

Fig. 3.32 Climb performance – comparison of methods.

the rate of descent in a flight idle glide or an autorotation. Data may be gathered economically if climbs and descents are combined using a sawtooth flight profile.

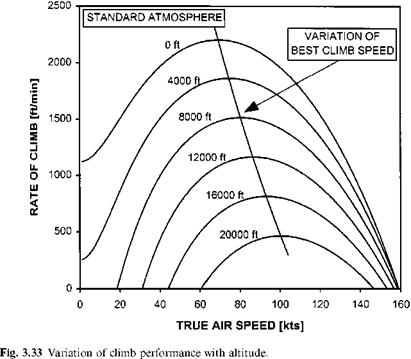
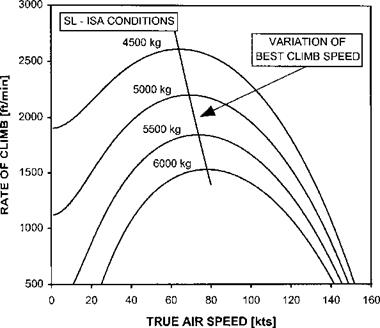
Consolidated plots can be compiled once data has been gathered for a range of conditions. Typically data is presented for a range of altitudes at the same all-up-mass or for a range of all-up-masses at the same altitude, see Figs 3.33 and 3.34 which show typical variations of climb performance with mass and altitude. These consolidated plots are then used to draw-up climb schedules for assessment during ceiling climb tests.

Estimating the climb performance

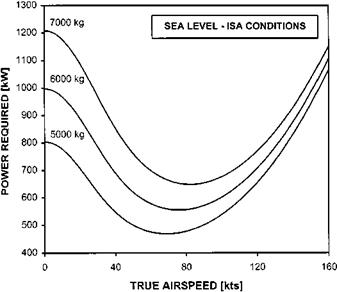
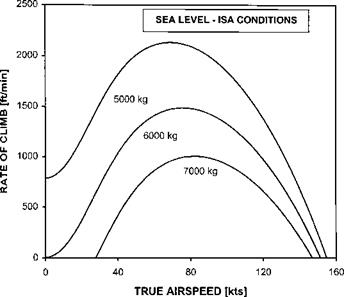
The accuracy of this approximation can be verified by an example. Consider a helicopter operating at SL-ISA with a 6.5 m radius 4-bladed rotor of 0.4 m chord. If the horizontal drag area is 2 m2 and the main rotor profile drag coefficient is 0.01 the variation of PFLF with TAS and AUM will be as shown in Fig. 3.26. Suppose the maximum power available under SL-ISA conditions is 1 MW. Then from Equation (3.3) the variation of RoC with TAS and AUM can be determined with relative ease, see Fig. 3.27. Comparing this approximate method with the results from a fuller approach (Fig. 3.28) shows that the two are in close agreement for airspeeds in excess of ^мр.

3.6.1.1 Problems with wasted power

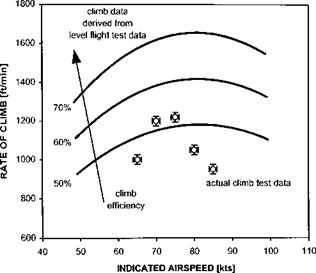
Using data from flight tests (see Fig. 3.29) it is clear that estimating climb performance from level flight data is not straightforward in practice. The difficulty lies in determining

image69

Fig. 3.26 Variation of power for level flight with AUM.

image70

Fig. 3.27 Variation of RoC with TAS and AUM.

the percentage of excess power that is available as climb power. For an accurate estimate it is necessary to determine the precise amount of power wasted through transmission losses and in generating the extra anti-torque force needed as a con­sequence of the greater collective pitch applied to the main rotor. The simplest

image71

Fig. 3.28 Estimates of climb performance.

image72

Fig. 3.29 Estimates of climb performance based on level flight data.

approach of assuming that all the excess power available is taken up as climb power will typically lead to an overestimate of the actual rate of climb, although the speed for best rate of climb will usually be predicted quite accurately. More accurate estimates of climb performance can be made by incorporating the concept of a climb efficiency factor (pc) [3.8]:

mg

Analysis of a climbing helicopter using momentum theory

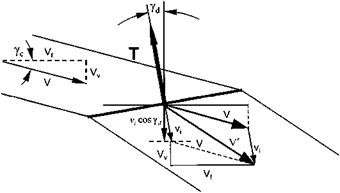
Before describing how the experimental method can be adapted for use in climb performance testing it is worthwhile to use simple momentum theory to analyse the factors affecting a helicopter in climbing flight. Figure 3.24 shows the change in velocity that occurs as flow passes through a climbing actuator disk.

As before, analysis begins by balancing the forces acting on the centre of gravity:

T cos yd = mg + d, = mg +1 p V 2 Sv T sin yd = df = 2 pV 2 Sf

image67

Fig. 3.24 Momentum disk theory applied to a climbing rotor.


Therefore:

pv 2 sf

tan yd = ——————- ■—f—

2mg + pV 2 Sv

Note how the airspeed of the helicopter has been broken down into horizontal and vertical components, each responsible for drag generation (calculated using the concept of drag area). Applying the elliptic wing analogy:

T = 2pAvV’

Now:

Analysis of a climbing helicopter using momentum theory Подпись: T 2pA VV 2 + 2vi(Vf sin yd + Vv cos yd) + v2 Подпись: (3.1)

V’ = V Vf + vi sin yd )2 + (Vv + vi cos yd )2

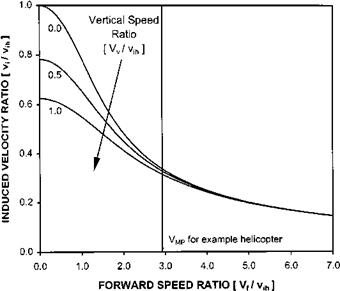
Equation (3.1) can be solved iteratively to yield the variation of induced velocity with forward speed and vertical velocity, see Fig. 3.25. From the figure it can be seen that for typical forward velocities (в 3 vih) the variation of induced velocity with ROC is negligible. This is a very convenient result since it means that the extra power required to climb can be simply added to that required for level flight. Thus the climb power is given by:

Pclimb = 1.2Tvi +1 pV 3 Sf + 8 pbcRCDVT (1 + 4.3p2) + TVv +1 pVv3 Sv (3.2)

image68

Fig. 3.25 Variation of induced velocity with RoC and TAS.

Alternatively if the power available, in excess of the power required for level flight (PFLF), is known then:

1 „

P = TV + – nV3 S

x excess v 1 2 г V ^V

and if the parasitic drag and download are small compared with all-up-weight then:

P

V = .excess (3.3)

mg

Equation (3.3) suggests that the climb performance is directly proportional to the excess power available and therefore the forward speed for maximum ROC (VY) will equate to the minimum power speed (VMP).

One-engine inoperative testing

All vertical performance test methods remain valid in an OEI situation but particular attention must be paid to the engine rating used. It may be necessary to get dispensation to operate at, for example, a 5-minute power rating for relatively prolonged periods in order to accomplish adequate testing. Under normal circumstances the power required will not change OEI and the engine’s performance will still be obtainable from test bed data. However, some aircraft require a different NR to be used OEI and so extra testing will be required in this case. As a first estimate it may be permissible to use data gathered during ‘all engines operative’ testing and simply apply the OEI limits to get the desired performance information. However, actual OEI testing should be conducted later to confirm the estimates. OEI operation may in fact consume more power because of asymmetric loading of the transmission and adverse engine inlet conditions.

3.5 CLIMB PERFORMANCE TESTING

Despite the majority of helicopter roles requiring flight only at low level there is sometimes a need to climb rapidly and efficiently to altitude. Although the main object of partial climb performance testing is the determination of the optimum climb speed and associated rate of climb, of equal importance is the variation of these parameters with density altitude, rotor speed, power available and aircraft mass. Associated tests are the documentation of pressure errors and the assessment of engine and rotor governing characteristics. The pressure errors may differ markedly from those recorded during level flight tests because of changes in main rotor wake strength and direction.

Vertical climbs

Both reduced power verticals and maximum power verticals can be conveniently combined with OGE hover tests. Once the hover data has been taken, the desired torque increment can be added and the aircraft timed through an altitude band of around 400 ft, or for 20 seconds. Split times are recorded at intermediate altitudes so that a mean, smoothed ROC can be determined. A more accurate result can be obtained by adjusting the mean altitude to ensure that the referred weight remains essentially constant for each hover/RPV/MPV combination. If static droop is present, Nr will change as power is added and so an adjustment will have to be made to regain the desired referred rotor speed once the climb has been stabilized. It is easy to underestimate the altitude that will be required to achieve this. A further complication arises if the test team attempts to target a constant value of referred power available as this will involve adjustment of the collective as altitude increases and air temperature and density fall. In practice such adjustments are both difficult to make accurately and are very time-consuming. Consequently, an average torque value is recorded at a fixed collective position. If desired, TE can be evaluated using similar techniques to those applicable to the hover case.

A plot of referred ROC versus referred power for a given referred weight reveals that the relationship between power increment and ROC is approximately linear and that the lines are broadly parallel. A considerable amount of time and effort can therefore be saved by conducting only hover and MPV points at a given referred weight. With careful planning a very efficient use of time can be achieved as follows: [2]

This method relies on the expeditious establishment of successive test conditions. Only about 5 minutes can elapse between the hover and MPV points for a given referred weight otherwise the fuel burn will be excessive and more than 100 ft will be required to compensate for it. It is important to ensure that m/^9 is kept constant. In particular the effects of static droop must be accounted for when conducting MPVs by setting a slightly higher Nr in the hover before power is applied. During the MPV, adjustments are made to the NR to achieve the required value of m/^9 at the point where data is taken.

Tethered hovering

Tethered hovering is a versatile technique and is widely used. The helicopter is attached to the ground by a cable of known length fitted with a tensiometer. A wide range of effective weights can be evaluated in a short time as the rotor thrust can be varied from a low to a high value without the need for reballasting. Although the minimum and maximum weights that can be studied are usually the same as can be flown using the ground referenced method, the big advantage of this method is that height control ceases to be a problem. Therefore given good weather conditions and access to a range of cable lengths, accurate IGE and OGE performance figures can be obtained in a short time. A further possible advantage is that of safety: a multi-engine helicopter may be flown throughout the test at an actual AUM for which it has OEI hover performance. However, unless a high altitude test facility is available, data at the higher referred weights will be lacking. As with the ground referenced method, tethered hovering tests demand very light winds. Turbulence or wind fluctuations tend to play havoc with hovering accuracy and the cable tension.

Disadvantages of this method are those associated with the items of additional equipment and extra personnel required to conduct a potentially hazardous test technique in reasonable safety. A tensiometer, usually a strain gauge device, is placed in series with the aircraft’s cargo hook. It is obviously undesirable to allow the tensiometer to fall to the ground from any significant height and so test procedures will have to be conducted accordingly. Some installations employ a modified cargo hook and the tensiometer remains attached to the aircraft at all times. The tensiometer typically drives a cable tension indicator that is temporarily mounted in the cockpit where it can be seen by both the observer and the pilot. More sophisticated test installations will be capable of providing the pilot with a ‘cross-hairs’ type indication of cable angle. A single sensitivity setting may be inappropriate for all cable lengths, in particular they are often too sensitive for use with short cable lengths. The cockpit indicator is placed so that the pilot can easily scan to it whilst retaining a good view of external hover references. Ground marshallers may be required in the absence of a cable angle indicator and, possibly, as a back-up to such a device, to assist the pilot in maintaining the cable vertical. A range of cable lengths designed to give the required wheel/skid height will be required. The cables need to be proof loaded and certificated to the maximum likely working tension. The tethering point should be in a clear area well away from structures that could cause recirculation. The surface should be level and smooth and, preferably, hardened to facilitate handling the cables. As with the cables the actual tie-down ring should be proof-loaded and certificated. Well-briefed and practised ground handlers will be required to facilitate cable changes. Ground observers are required to observe the cable angle and indicate corrections to the pilot accordingly. The employment of a site controller, in radio contact with the pilot, is an effective risk reduction measure as is the carriage of a rear crew member to monitor the cable angle and advise the pilot on positioning.

The cable should be as close to vertical as possible when data is taken, the maximum error which can be tolerated is typically +10°. Aircraft plan position must thus be held very accurately, this is particularly important when short cable lengths are used. The optimum method of maintaining plan position varies according to cable length. For short cable lengths (about 20 ft or less) the best hover cues are the normal external references. The exclusive use of a cable angle indicator may well lead to overcontrolling. For very short cables the necessary accuracy may be achieved by observing the position of the aircraft’s shadow relative to a feature on the ground. A cable angle indicator becomes more ‘user-friendly’ with cable lengths greater than about 20 ft. The best technique may be to identify the correct position using the indicator and then to maintain that position using normal hover techniques.

The cable tension, and therefore the effective AUM of the aircraft, can be varied very quickly and so the most expedient test method is to explore a range of tensions for a given cable length, NR and loading and then to change NR, cable or ballast before repeating the process. For a particular condition the cable tension will vary from a maximum that is limited by the effective mass, hook limits or power, to a minimum limited by the requirement to maintain a small nominal tension to aid precise height control.

Since the force applied to the helicopter by the cable tension is below the CG, an excessive cable angle is destabilizing therefore the normal and emergency cargo release mechanisms must be checked and be functional before commencing these tests. After the cable is attached, the cargo master is usually selected to ON to facilitate a rapid emergency release. Usually the after take-off checks are performed in an IGE hover over the tether point before the aircraft is climbed vertically until the cable goes taut.

It is important to avoid snatching the cable since this could cause either structural damage or a premature failure of the cable. Once minimum cable tension has been established, power is progressively applied to achieve the desired value. Longitudinal compensation is often required as the effective CG changes with increases in hook load. Once the test condition has been stabilized it is unwise to chase the cable tension, it being better to leave the collective fixed and take an average tension reading. Data recording will facilitate this process. It may be advantageous to allow the co-pilot/ observer to control the collective while the pilot concentrates on maintaining an accu­rate plan position. If the aircraft drifts well out of position it is important to allow the cable to go slack immediately before resuming the correct plan position and reapplying tension. Helicopters have been rotated into the ground by a combination of excessive cable angle, high cable tension and low control power. On completion of the tests, it is vital that the pilot receives a verbal assurance from the groundcrew that the cable has been disconnected from the aircraft before being marshalled from the test site.

Ground-referenced hovering

Ground-reference vertical performance test techniques are primarily used to determine IGE performance although a limited amount of OGE data may also be gathered. The range of referred weights will be restricted by the elevations of the available test sites.

The method is often very time-consuming since frequent ballast adjustments are required to both establish and maintain a range of referred weights.

The method obviously requires extremely light wind conditions, typically less than 3 kts. A mast-mounted anemometer located at the hover height is often used to ensure that this condition prevails. A pace vehicle may be used in light to moderate winds to achieve zero airspeed provided the wind strength and direction are steady and an into – wind track can be found. Caution must be exercised to avoid downwash interference as the test point is established. It is often best to give the pace vehicle driver the opportunity to determine what ground speed gives the best average still-air condition with the helicopter well clear. This ground speed can then be maintained as the helicopter approaches to establish a good relative position reference. The most usual height reference is the aircraft’s radar altimeter. Zero-errors are eliminated by subtracting the residual reading obtained when the aircraft is on the ground from any height datum. An alternative method is the use of a weighted rope whereby a crew member voice-marshals the aircraft in the vertical axis to keep the end of the rope just brushing the ground. External references may also be used but these will be subject to parallax errors.

A series of ground-referenced hovers are flown at different heights to document ground effect and to determine the IGE/OGE boundary. Once this has been accom­plished, testing will concentrate on role-relatable hover heights (particularly in the case of rotorcraft destined to conduct roles requiring a load lifting or winching capability). A test session will normally be commenced at maximum AUM. If desired, a rotor speed sweep can be conducted at each hover. The AUM should be maintained within about 1% of the nominal value and so frequent reballasting (perhaps once every 10 minutes) will be required to compensate for fuel burn. Once the range of heights has been completed at a particular weight, ballast is reduced and the process repeated. Accurate data requires the minimum of pilot interference during the test point itself. Consequently the collective is not moved during data gathering and the aircraft is allowed to drift up and down gently as necessary. If height excursions exceed about +10% of the datum the weather will generally be unsuitable for accurate testing.

Free-air hovering

Clearly the free-air hover technique necessitates some form of omnidirectional low airspeed measurement system so that stabilized vertical flight, relative to the local air mass, can be achieved in the absence of outside references. A variety of systems have been developed; some are restricted to the research environment while others have been produced commercially, primarily for use within fire control computation in weapon systems. Most systems drive a low velocity indicator (LVI) display in the cockpit that comprises a ‘cross-hair’ presentation of longitudinal and lateral airspeed. A selection of methods is described below.

The Hovermeter was a joint CEV/A&AEE development aimed specifically at trials work. It relies on the fact that the rotor downwash in the hover is effectively vertical, with only small swirl and convergence components. A pair of vanes, one pivoted about the X-axis and the other about the F-axis, are mounted in the downwash clear of fuselage turbulence effects. When a small airspeed causes the downwash angles to change, the vanes deflect from their neutral position and cause a commensurate change in cockpit indications. The primary shortcoming of this system is that it cannot compensate for variations in downwash velocity caused by rotor thrust changes.

The Omnidirectional Air Data System (Pacer/OADS) is fitted to the AH 64A Apache and the HH-65 Dolphin. It comprises a pair of total pressure ports mounted on each end of a rotating boom that is concentric with the rotor mast and mounted above the rotor disk. A comparison of the two pressure measurements, via a central diaphragm device, determines the magnitude of any horizontal airspeed. A synchro unit allows the resolution of the direction by comparing the phase of the pressure differential signal with a reference.

The Helicopter Air Data System (HADS) is fitted to some marks of the AH 1 Cobra and the AH 64D Apache. It comprises a boom-mounted swivelling pitot-static head, which is designed to align itself with the local airflow. Once calibrated, the angles of the swivel and the magnitude of the pitot pressure can be resolved to give omni­directional airspeed indications.

The Vitesse Indiquee Mesure Installation dessais (VIMI) system was developed by the CEV for research but a sophisticated application of the device has been suggested for use in the Tiger attack helicopter programme. The VIMI relies on the principle that the rotor, and therefore the swashplate, will assume a unique orientation relative to absolute vertical when the helicopter is in the hover at a particular AUM. In its simplest form the VIMI compares pitch and roll attitudes to cyclic control positions and resolves a flight director display which tells the pilot what control inputs are required to achieve a hover. However, airspeed is not the only influence on attitude and control position in the hover and so a simple VIMI system can only be optimized for one AUM and CG condition. A more sophisticated system would employ a microprocessor to compute the effects of AUM, CG and tail rotor roll (pedal position).

With the possible exception of the VIMI, the big drawback to all of these systems is that they require independent calibration for a particular installation. This is normally achieved by conducting a series of low airspeed points using a pace vehicle. A range of AUM and IGE and OGE points may have to be flown. In the case of the HADS, this process is known as the ‘characterization’ of a particular installation. The effect of air density will need to be taken into account to ensure that a system that has been characterized at low altitudes gives accurate indication at higher altitudes.

The installation and calibration of a low airspeed sensing system is clearly impractical for all but the most prolonged test programmes. The formation method, which entails flying the test aircraft close to a suitably equipped ‘pace’ aircraft and using it as an external hover reference, provides a practical alternative. The optimum separation is twice the rotor diameter of the larger aircraft. Any closer is not only dangerous but can also produce distortion of the results due to downwash interference. The greater the separation the more difficult it becomes to hold a steady relative position. One minor complication is that if the changes in hover power requirement with fuel burn of the two aircraft are significantly different, relative vertical motion can develop over the duration of a test point despite the maintenance of constant power settings. The formation method may be extended to cover vertical climb testing provided the helicopters have compatible vertical agility. In this case the test aircraft initiates the desired ROC and the reference aircraft matches the ensuing climb. It is best to have two crew members in the reference aircraft so that the pilot can concentrate on maintaining vertical flight whilst his colleague observes the test aircraft and advises on power settings. Thus the test aircraft can maintain a constant power setting while the reference aircraft remains responsible for maintaining plan position.

When entering a free-air hover using internal references extreme caution must be exercised to avoid vortex ring, loss of control due to inadvertent rearwards flight and overtorqueing. Our experience suggests that the best technique is to approach the hover from slightly below the desired altitude. The initial deceleration to, say, ten knots less than Vimp may be conducted quite rapidly but thereafter it is crucial to anticipate the requirement for additional power as speed is reduced further. A constant decelerative attitude (say about 5 degrees nose-up) is maintained until the longitudinal airspeed is virtually zero at which point a hover attitude is positively selected whilst making due allowance for tail rotor roll and with sufficient power applied to prevent a ROD. If insufficient power is available, the test point should be rejected by selecting a positive accelerative attitude and flying away. Once a coarse hover has been established, small attitude/trim adjustments may be made to refine the zero airspeed condition. Once the hover is established, small collective adjustments in either direction may be made to refine the altitude. To guard against an inadvertent entry into the vortex-ring condition a ROD of greater than about 300 ft/min should not be allowed to develop. Equally the minimum hover height (AGL) should be chosen with due consideration of the anticipated height loss involved in recovering from inadvertent entry into the vortex-ring condition.

The actual method of test for free-air hovering is self-evident. The test aircraft is simply stabilized at the highest desired referred weight, using whatever reference is available, and data is recorded. A rotor speed sweep may be conducted at each hover either to increase the range of tested Wlam2 or to evaluate TE. Remember that a change in Nr will always affect W/am2 and will require a collective adjustment to maintain zero vertical speed. This procedure is then repeated as required at decreasing altitudes until the desired range of referred weight has been achieved. The normal aircraft VSI is used to determine the desired ROC. There may well be inaccuracy in the VSI readings, especially near the hover, and so frequent cross checking to the altimeter is required. Once experience is gained with a particular installation, it becomes simple to set up, for example, a 50 ft/min ROD (indicated) to actually achieve a hover.

General test conditions and methodology

Tests are normally planned to allow the widest possible range of referred AUM and generally start at maximum altitude and high AUM (maximum fuel and ballast) and progress to a ‘light and low’ condition via a descending series of hovers. It may be advantageous to have the aircraft cleared to operate at an overload weight for the purposes of these tests. The presence of external stores and/or the operation of movable aerodynamic surfaces may influence vertical performance. Where this is the case, a range of configurations should be tested at a number of nominal atmospheric conditions. Centre of gravity (CG) position is not usually critical to vertical perfor-

image65

Fig. 3.22 Referred vertical climb test data – MPV method.

image66

Fig. 3.23 Smoothed vertical climb data.

mance and so a nominal mid-position is normally chosen. The use of airbleeds will reduce the available engine power and consequently the performance of the aircraft when engine-limited. Most testing is conducted with airbleeds OFF but comparative tests with various combinations of heaters, anti-ice and other significant electrical loading may be required. Inside ground effect (IGE) hover points should be flown at a variety of wheel/skid heights to determine the magnitude of ground effect and the IGE/OGE boundary. Rotor speed may be adjusted within the continuous power-on range in order to maintain m/V0 at the desired value. For vertical performance testing, the effect of relative humidity (RH) is usually ignored. However, if the aircraft is required to operate in hot conditions it may be necessary to account for it. For example, at 30°C and sea level, 100% RH makes the true DA about 1000 ft higher than that calculated from Hp and OAT alone.

If only one test site is available, the range of referred weights attainable will be restricted by the local ambient conditions, although seasonal variations may be exploited on a long test programme. A comprehensive performance trial will normally be conducted in temperate conditions and then supplemented by further testing in hot and high conditions. Additionally data may be recorded during ice and snow trials. IGE tests are further restricted by the actual elevation of the test site(s). The necessity to conduct ground-referenced IGE tests at high elevation and in a wide range of temperatures often entails testing at a remote site with a commensurate increase in the flight time budget. Careful planning may be required to achieve the maximum possible referred weight range within the constraints of limited engine performance. It may be necessary to fly ‘very heavy and low’ rather than ‘heavy and high’ for a particular condition due to the engine’s inability to produce sufficient power at high altitude.

Since the advance ratio is zero in the hover, it is unlikely that there will be significant compressibility effects in most hover conditions unless the ambient temperature is very low and/or the altitude is high. At high thrust coefficients, however, the drag rise Mach number at the blade tip may be sufficiently low to cause a significant increase in drag and thus of power required. Equally, there may be local blade stalling which will contribute to an overall increase in power over and above that predicted by simple theory. Tip effects (TE) are rarely significant except in the case of a dramatic increase in the operational weight or significant change to the theatre of operations. It may be possible, therefore, to reduce the total amount of testing by conducting specific tests designed to expose these effects. Tip effects are most evident when high m/^0 (high Nr and low OAT) is combined with a high AUM. The widest possible OAT range is therefore required for TE testing and this is most easily achieved by hovering at different altitudes. For rotorcraft with fixed NR, test conduct becomes problematic since, for a given atmospheric condition, there will be a unique relation between 0 and a. Thus, for any given value of W/am2 the only parameter that can be varied independently is the all-up-mass (W). Consequently, a considerable number of changes in mass and a succession of climbs and descents will be required to obtain data for a range of referred rotor speeds at the desired referred weights. If specific testing shows that TE are insignificant, subsequent performance testing may be accelerated by changing rotor speed to increase the available range of Wlam2 for a given ambient condition and ignoring the effect of ambient temperature on blade tip Mach number.

3.5.3 Flight test techniques