Category MECHANICS. OF FLIGHT

Flight at transonic speeds – drag and power required

There was a time when the prospects of supersonic flight seemed poor owing to the lack of engines with the necessary power to overcome the rapid rise in drag which begins at the critical Mach Number. Even without compressibility effects the drag would rise with the square of the velocity, and the power – which is Drag X Velocity – with the cube of the velocity. The effect of com­pressibility is to increase these values still further in accordance with Table

11. 2, which shows the approximate figures for a Spitfire.

Table 11.2 Power required with compressibility

Velocity (knots)

250

350

450

550

650

Velocity (m/s)

129

180

232

283

335

Velocity (km/h)

464

649

834

1019

1205

Power (kW) without compressibility

750

1900

2430

6000

9700

Actual power required (kW)

750

1900

2510

7500

22 000

Actually the problem was much more serious than this, if we assumed that the aircraft would be driven by propellers. As was explained in Chapter 4, the efficiency of a good propeller is about 80 per cent at its best, but its ‘best’ is at speeds of 129 to 180 m/s, after which the efficiency falls off very rapidly (although a new generation of propellers has pushed this up) – this happens for various reasons, but chiefly because the propeller tips are the first part of the aircraft to suffer from compressibility. With the high forward speed of the aeroplane combined with the rotary speed of the circumference of the propeller disc, Mach Number troubles begin to occur at aircraft speeds of about 180 m/s, and the result is so disastrous that the power which would have to be supplied to the propeller by the engine in order to attain the speeds given in Table 11.2 would look something more like Table 11.3 a con­ventional propeller.

Table 11.3 Power required accounting for propellor efficiency

Velocity (m/s) 130 180 230 280 335

Power (kW) to be given to propeller 820 2390 6000 15 000 100 000?

When one looks at these figures one realises why it was that people who knew what they were talking about forecast not so many years ago that it would be a long, long time before we could exceed 300 m/s.

Yet they were wrong. And for one simple reason – the advent of the gas turbine and the first flight of a jet-driven aircraft in 1941. This made all the difference, partly because of the elimination of the propeller and its compress­ibility problems (it is true that there are similar problems with the turbine blades in the jet engine), but mainly because, the efficiency of the jet increases rapidly over just those speeds, 154 to 257 m/s, when the efficiency of the propeller is falling rapidly. The net result is that whereas the reciprocating- engine-propeller combination requires nearly twenty times as much power to fly at 500 compared with 250 knots, the jet engine only requires about five times the thrust, and it is thrust that matters in a jet engine. Further, the weight of the jet engine is only a small fraction of that of the reciprocating-engine- propeller combination, and at this speed even the fuel consumption is less.

Maybe the prophets ought to have foreseen the jet engine – but they didn’t, at least not within anything like the time during which it actually appeared. Of course, there were good reasons too why they didn’t foresee it, for no metal could then possibly stand up to the temperatures of the gas turbine blades.

The jet engine, then, was the first step in solving the problem of high-speed flight. And while on the subject of engines, the rocket system of propulsion takes us even a step further and no one now, who knows the subject dares predict the limits of speed that may be reached with rockets – outside the atmosphere there really isn’t any limit.

As hinted above, it is interesting to note that lately the wheel looks like turning a full circle. Improvement in propeller design means that the tip prob­lems can be largely overcome and a gas turbine/propeller combination promises better efficiency in the future than a turbojet at transonic speeds.

Subsonic – transonic – supersonic

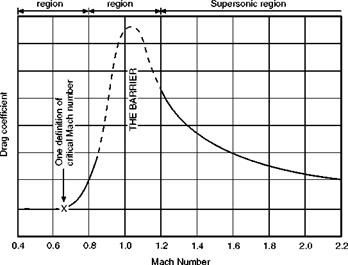
We have already talked about flight at subsonic, transonic, and supersonic speeds, and it should now be clear that the problems of flight are quite dif­ferent in these three regions, but the dividing lines between the regions are of necessity somewhat vague. Figure 11.7 shows the subsonic region as being below a Mach Number of 0.8, the transonic region from M 0.8 to M 1.2, and the supersonic region above M 1.2. There are arguments in favour of consid­ering the transonic region as starting earlier, say at a Mach Number of about 0.7 or near the point marked in the figure as the critical Mach Number, and extending up to say a Mach Number of 1.6 or even 2.0. In terms of sea-level speeds this would mean defining subsonic speeds as being below 450 knots, transonic speeds as 450 up to 1000 or even 1200 knots, and supersonic speeds above that.

Perhaps the best definition of the three regions is to say that the subsonic region is that in which all the airflow over all parts of the aeroplane is subsonic, the transonic region is that in which some of the airflow is subsonic and some supersonic, and the supersonic region is that in which all the airflow is super­sonic. Once again we are in trouble if we take our definition too literally. Even at very high speeds we may have local pockets of subsonic flow – just in front of a blunt nose for example. So the Space Shuttle would only be transonic even at the fastest point of re-entry! Also with this definition we are none the wiser as to the speeds or Mach Numbers at which each regions begins or ends; the beginnings and endings will of course be quite different for different aeroplanes.

In this chapter our main concern is with speeds in the transonic range, and particularly in the narrow range between Mach Numbers of 0.8 and 1.2. This

range, as is probably already evident, presents us with some of the most baf­fling but fascinating problems of flight; it is the range in which most of the change takes place, the change from apparent incompressibility to actual com­pressibility, the gradual substitution of supersonic flow for subsonic flow; it is the range about which we are even now most ignorant.

Drag rise in the transonic region

The behaviour of the drag coefficient, for a thin aerofoil shape at constant angle of attack, can best be illustrated by a diagram (Fig. 11.7). This shows that up to a Mach Number of about 0.7 the drag coefficient remains constant – which means that our elementary principles are true – then it begins to rise. According to one definition the Mach Number at which it begins to rise, in this example 0.7, is the critical Mach Number. At M of 0.8 and 0.85 CD is rising rapidly. Note that the curve then becomes dotted and the full line is resumed again at an M of about 1.2. The reason for this is interesting. For a long time, although it was possible to operate high-speed wind tunnels up to an M of about 0.85, and again at M of 1.2 or more, in the region of the speed of sound a shock wave developed right across the wind tunnel itself, the tunnel became ‘choked’ and the speed could not be maintained. Thus there were no reliable wind tunnel results in this region, and the dotted part of the curve was really an intelligent guess. This difficulty has now been overcome, and experiments have also been made by other means, by dropping bodies, or propelling them

Subsonic Transonic

Drag rise in the transonic region

Fig 11.7 Transonic drag rise with rockets and also, of course, by full-scale flight tests, and the guess can now be confirmed. Previous experiments on shells had of course suggested that there was nothing much wrong with it. The curve is still left dotted, partly to remind us of this bit of aeronautical history, but more now to emphasise the strange behaviour of the drag coefficient in the transonic region.

After a Mach Number of about 1.2, CD drops and eventually, at M of 2 or more becomes nearly constant again though at a higher value than the orig­inal, variously quoted as 2 or 3 times.

The diagram shows that there is a definite hurdle to be got over. But it also shows that conditions on the other side are again reasonable and that super­sonic flight, as we now of course know only too well, is a practical proposition.

The reader is advised to work through Question 253 (Appendix 3) in which he will plot the actual drag, as distinct from the coefficient, and it will then be clear that the drag also actually falls after M = 1, but that the reduction is not quite so evident in terms of drag as in terms of drag coefficient.

Critical Mach Number

It has already been made clear that the onset of compressibility is a gradual effect, and that things begin to happen at speeds considerably lower than the speed of sound, that is at Mach Numbers of less than 1. One reason for this is that, as explained in earlier chapters, there is an increase in the speed of airflow over certain parts of the aeroplane as, for instance, over the point of greatest camber of an aerofoil. This means that although the aeroplane itself may be trav­elling at well below the speed of sound, the airflow relative to some parts of the aeroplane may attain that value. In short, there may be a local increase in vel­ocity up to beyond that of sound and a shock wave may form at this point. This in turn, may result in an increase of drag, decrease of lift, movement of centre of pressure, and buffeting. In an aeroplane in flight the results may be such as to cause the aircraft to become uncontrollable, in much the same way as it becomes uncontrollable at the high incidence stall at the other end of the speed range.

All this will occur at a certain Mach Number (less than 1), which will be different for different types of aircraft, and which is called the critical Mach Number (Mcr) of the type.

The reader who has followed the argument so far will not be surprised to learn that the general characteristic of a type of aircraft that has a high critical Mach Number is slimness, because over such an aircraft the local increases of velocity will not be very great. This was well illustrated by the Spitfire, a ‘slim’ aircraft that was originally designed without much thought as to its perform­ance near the speed of sound, yet which has proved to have a critical Mach Number of nearly 0.9, one of the highest ever achieved.

We had some difficulty in deciding whether the ordinary stalling speed should be defined as the speed at which the lift coefficient is a maximum, or at which the airflow burbles over the wing, or at which the pilot loses control over the air­craft. They are all related, but they do not necessarily all occur at the same speed. So now with the critical Mach Number – is it the Mach Number at which the local airflow at some point reaches the velocity of sound? or at which a shock wave is formed? or at which the air burbles? or when severe buffeting begins (this is sometimes called the ‘buffet boundary’ of the aircraft)? or at which the drag coefficient begins to rise? – or, again, when the pilot loses control? I do not know – nor, apparently, does anyone else! Authorities differ on the matter, each looking at it according to their own point of view, or sometimes according to whether they want to claim a high critical Mach Number for a pet type of aircraft. However, it doesn’t matter very much; they are really all part of the same phenomenon.

Is it possible for an aircraft to fly at a Mach Number higher than its critical Mach Number? Is it possible for an aircraft to have a critical Mach Number higher than 1 ? These two questions may at first sound silly, but they are not. The answers to both depend entirely on which of the many definitions of critical Mach Number we adopt. If the critical Mach Number is when the pilot loses control, then he can hardly fly beyond it; but if it is when a shock wave is formed, or when the drag coefficient begins to rise, why not? The pilot may not even know that it has happened, any more than he knows whether he is at the maximum lift coefficient in an ordinary stall. Graphs of lift and drag coefficients are all very well, but one cannot see them on the instrument panel when flying. Supposing the pilot can maintain control through all the shock waves, increases of drag coefficient and so on, then the critical Mach Number is higher than 1 or, to be more correct, the aircraft has not got a critical Mach Number in any of the senses that we have so far defined it, except for the one relating to the first appearance of supersonic flow locally or the first appear­ance of shock waves.

Variation of speed of sound

There is one small complication that must be introduced into the definition of Mach Number even at this stage. The speed of sound varies according to the temperature of the air, and therefore we must add to the definition the fact that the speed of sound must be that corresponding to the temperature of the air in which the aircraft is actually travelling. People are often surprised to hear that the speed of sound in air depends on temperature alone.

The actual relationship is that the speed of sound is proportional to the square root of the absolute temperature.

We have seen that temperature falls with height in the atmosphere, and in the stratosphere where the temperature is about — 60°C (213 K) the speed of sound will have fallen from about 340 m/s at sea-level to about 295 m/s.

Perhaps it should be emphasised again that this drop in the speed of sound is not really a function of the height at all; at a temperature of —60°C such as may occur at sea-level in, say, the North of Canada in winter, the speed of sound would also be about 290 m/s, while in tropical climates it might be well over 340 m/s even at considerable heights.

This variation of the speed of sound with temperature accounted for the rather surprising feature of speed record attempts of some years back in that the pilots waited for hot weather, or went to places where they expected hot weather, in order to make the attempts. Surprising because it had always been considered, and was in fact true, that high temperatures act against the performance of both aircraft and engine. The point, of course, is that the record breakers wanted to go as fast as possible while keeping as far away as possible from the speed of sound – so they wanted the speed of sound to be as high as possible. Nowadays in breaking speed records the aim of the pilot is just the opposite, i. e. to get through the speed of sound as quickly as possible – but we are anticipating.

Mach Number

The time has come to introduce a term that is now on everybody’s lips in con­nection with high-speed flight – Mach Number. This term is a compliment to the Austrian Professor Ernst Mach (1838-1916), who was professor of the history and theory of science in the University of Vienna, and who was observing and studying shock waves as long ago as 1876. Incidentally, his

Mach Number

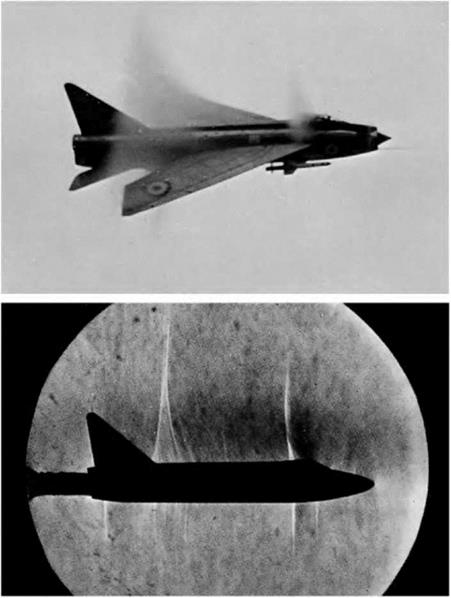
Fig 11В Shock waves

(By courtesy of the former British Aircraft Corporation, Preston)

Top: Lightning at M 0.98; low pressure regions above canopy and wing cause condensation, the rear limit of the condensation marks the shock wave.

Bottom: Schlieren photograph of model of Lightning at M 0.98; note the extraordinarily close resemblance to actual flight.

Science of Mechanics, which was published in English in 1893, throws much light on the work of Newton and others, and is well worth reading.

Fortunately the definition of Mach Number is simple. The Mach Number (M) refers to the speed at which an aircraft is travelling in relation to the speed of sound. Thus a Mach Number of 0.5 means that the aircraft is travelling at half the speed of sound. Both the speed of the aircraft and the speed of sound are true speeds.

Shock drag

The sudden extra drag which is such a marked feature of the shock stall has two main components. First the energy dissipated in the shock wave itself is reflected in additional drag (wave drag) on the aerofoil. Secondly, as we have seen, the shock wave may be accompanied by separation, or at any rate a thickening of and increase in turbulence level in the boundary layer. Either of these will modify both the pressure on the surface and the skin friction behind the shock wave.

So this shock drag may be considered as being made up of two parts, i. e. the wave-making resistance, or wave drag, and the drag caused by the thick turbulent boundary layer or region of separation which we will call boundary layer drag.

As has already been explained the shock wave and the thickened turbulent boundary layer or separation are like the chicken and the egg – we don’t know which comes first; what we do know is that when one comes so does the other. That is not to say that they are by any means the same thing, or that they have the same effects, or that a device which reduces one will necessarily reduce the other.

Effects of shock waves – the shock stall

It is clear from schlieren photographs that there is a sudden and considerable increase in density of air at the shock wave, but there is also, as has been stated, a rise in pressure (and incidentally of temperature), and a decrease in speed. Most important of all perhaps is the breakaway of the flow from the surface, though it is sometimes argued whether this causes the shock wave or the shock wave causes it. Whichever way it is the result is the same.

As is rather to be expected all this adds up to a sudden and considerable increase in drag – it may be as much as a ten times increase. This is accompa­nied, if it is an aerofoil, by a loss of lift and often, due to a completely changed pressure distribution, to a change in position of the centre of pressure and pitching moment, which in turn may upset the balance of the aeroplane. At the same time the turbulent airflow behind the shock wave is apt to cause severe buffeting, especially if this flow strikes some other part of the aeroplane such as the tail plane. One can hardly avoid saying – very like a stall. Yes, so like the stall that it is called just that – a shock stall.

But the similarity must not lead us to forget the essential difference – no it isn’t the speed, we have already made it clear, or tried very hard to make it clear, that the ordinary stall can occur at any speed; the essential difference is that the ‘ordinary stall’ occurs at a large angle of attack and, to avoid confu­sion, we shall in future call it the high-incidence stall to distinguish it from the shock stall which is more likely to occur at small angles of attack.

From what has already been said the reader will probably have realised that the formation of shock waves is not a phenomenon that occurs on the wings alone; it may apply to any part of the aeroplane. Even the shock stall, which may first become noticeable owing to the sudden increase of drag and onset of buffeting – it is sometimes called the buffet boundary – may be caused by the formation of shock waves on such parts as the body or engine intakes, rather than on the wings (Fig. 11B, overleaf).

Observation of shock waves

The understanding of shock waves is so important to the understanding of the problems of high-speed flight that it is worth going to a lot of trouble to learn as much as we can about them.

As we remarked so often in dealing with flight at subsonic speeds, it would all be so much easier to understand if we could see the air. Well, fortunately we almost can see shock waves; they are not merely imaginary lines, lines drawn on diagrams just to illustrate something which isn’t actually there, they

Observation of shock wavesSubsonic flow M= 0.6

Observation of shock waves

Fig 11.3 Breakaway of airflow

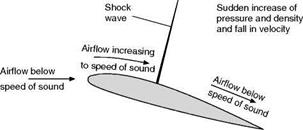
Fig 11.4 Incipient shock wave

Observation of shock waves

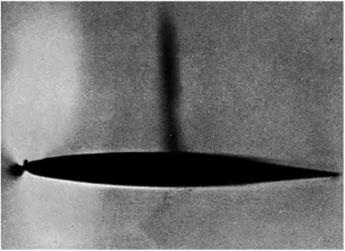
Fig 11A Incipient shock wave

(By courtesy of the Shell Petroleum Co Ltd)

An incipient shock wave (taken by schlieren photography) has formed on the upper surface; the light areas near the leading edge are expansion regions, separated by the stagnation area which appears as a dark blob at the nose.

are physical phenomena which can be photographed in the laboratory by suit­able optical means, and in certain conditions they may even be visible to the naked eye.

The photographic methods depend on the fact that rays of light are bent if there are changes of density in their path. In the ‘direct shadow’ method the shock wave appears on a ground-glass screen, or on a photographic plate, as a dark band with a lighter band on the high-pressure side. But the system that has proved most effective is known as the ‘schlieren’ method, and the results obtained by it are so illuminating, and have contributed so much to our under­standing of the subject, that the method itself deserves a brief description. The word ‘schlieren’, by the way, is not the name of some German or Austrian sci­entist, but simply the German word for streaking or striation, which is descriptive of the method; nor is the method itself modern, it was used a hundred years ago for finding streaks and other flaws in mirrors and lenses, just as it now finds ‘flaws’ or changes of density in the air.

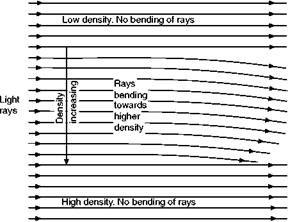
The fundamental principle behind the schlieren method is that light travels more slowly through denser air; so if the density of air is changing across, or at right angles to, the direction in which light rays are travelling, the rays will be bent or deflected towards the higher density (Fig. 11.5). Notice that the bending only takes place when the density of the air is changing (across the path of the rays) – there is no bending when the rays pass through air density which is constant across their path, nor if the density changes along their path; in those cases the rays are merely slowed up by high density.

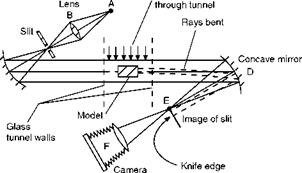
Figure 11.6 (overleaf) shows a typical arrangement of mirrors and lenses as used in the schlieren method. From a light source A the rays pass through a lens B, to a concave mirror C, which reflects parallel rays through the glass walls of a wind tunnel to another concave mirror D, which in turn reflects the rays on to a knife edge at E, where an image of the light source is formed. Rays that pass through changing density near the model in the tunnel are bent, those passing through falling density being deflected one way, and those passing through rising density the other way. At E either more or less light will be let through depending on whether the ray has been deflected onto or away from the knife edge by the density changes. Thus the image of the working section at F will show light or dark areas (Fig. 11 A). In a film on High-speed Flight produced by the Shell Petroleum Company, to whom I am indebted for these schlieren pictures, a colour filter was used at E and in this ingenious way increasing density was shown on the screen in one colour, decreasing density in another, and unchanging density in yet another; thus giving a real live picture of changes of density as the air flowed over different shapes at different speeds.

It is interesting to note that whereas the schlieren method reveals the change of density in a certain distance, the direct shadow method shows changing rates of density change, and other methods, such as the Mach Zender and laser interferometers, the actual density in different places. So each method has its advantages, but each needs rather different interpretation if we are to realise exactly what it is showing us.

Figure 11A is a photograph of a shock wave obtained by the schlieren method, and the fact that it appears as a narrow strip at right angles to the top surface of the aerofoil shows that across the strip there is a sudden increase in

Observation of shock waves

Fig 11.5 Bending of light rays through changing density

Light

source Airflow

Observation of shock waves

Fig 11.6 Arrangement for schlieren photography View from above.

density. Immediately behind and immediately in front of the strip the density is reasonably constant, though greater of course behind than in front. Colour photography reveals another small area of increasing density immediately in front of the nose of the aerofoil as we might expect, and a large area above the nose and a smaller area below in which the density is decreasing.

Schlieren pictures of airflow at speeds well below that of sound show no appreciable changes of density at all, so now we see the fundamental change that takes place as we approach the speed of sound; the air begins to reveal its true nature as a very compressible – and expandable – fluid.

Shock waves

Let us see if we can find out a little more of what actually happens during the change from incompressible flow to compressible flow, and so discover the cause of the mounting error in making the assumption of incompressibility. Let us also investigate the ‘shock’, together with its cause and effects.

As the speed of airflow over say a streamline body increases, the first indi­cation that a change in the nature of the flow is taking place would seem to be a breakaway of the airflow from the surface of the body, usually some way back, setting up a turbulent wake (Fig. 11.3). This may occur at speeds less
than half that of sound and has already been dealt with when considering the boundary layer. It will, of course, cause an increase of drag over and above that which is expected at the particular speed as reckoned on the speed- squared law.

As the speed increases still further, the point of breakaway, or separation point tends to creep forward, resulting in thicker turbulent wake starting forward of the trailing edge.

This happens because, when we reach about three-quarters of the speed of sound, a new phenomenon appears in the form of an incipient shock wave (Figs 11.4 and 11A, overleaf). This can be represented by a line approximately at right angles to the surface of the body and signifying a sudden rise in pressure and density of the air, thus holding up the airflow and causing a decrease of speed of flow. There is a tendency for the breakaway and turbu­lent wake to start from the point where the shock wave meets the surface which is usually at or near the point of maximum camber, i. e. where the speed of airflow is greatest.