The Computed Radiation-Adiabatic Temperature Field
We discuss now only the Navier-Stokes solution for the larger wing with L = 14 m. Fig. 3.21 gives an overview of the results on the lower and the upper surface. On the left-hand sides of the figure the radiation heat flux (qrad) distributions are shown, and on the right-hand sides the radiation-adiabatic temperature (Tra) distributions. Unfortunately the color scales are not the same in the two parts a) and b) of the picture. For quantitative data at the two locations x/L = 0.14 and x/L = 0.99 see Fig. 3.24.
We concentrate on the distributions of the radiation-adiabatic temperatures on the right-hand sides. Part a) of Fig. 3.21 shows on the lower side of the wing the almost parallel flow between the primary attachment lines. The radiation adiabatic temperature reduces in downstream direction as expected. On the larger portion of the lower side it lies around 800 K (see also Fig. 3.22). Along the primary attachment line attachment-line heating ensues with a nearly constant temperature of approximately 1,100 K. This is a hot-spot situation.
On the upper side, part b), along the leading edge we also see a nearly constant temperature of about 1,050 K. This high temperature is due to the small boundary-layer thickness, which is a result of the strong expansion of the flow around the leading edge. At the primary separation line the temperature drops fast and a real cold-spot situation develops. The secondary attachment line seems to taper off at about 40 per cent body length. Possibly a tertiary vortex would develop, if the wing length would be increased (non-conical behavior). At the secondary separation line again a cold-spot situation, however weaker than that at the primary separation line, develops. The tertiary attachment line shows the expected attachment-line heating with an almost constant temperature of approximately 650 K along the upper symmetry line.
Fig. 3.22 displays the temperature distribution along the upper and the lower symmetry line of the wing. Note that the abscissa is given with the computation-grid parameter i. The inset shows its correspondence to x/L. The temperature at the windward side is typically higher than that at the leeward side. We will come back to this temperature differential. The kink in the windward-side curve at i « 26 seems to be due to the curvature jump of the surface there (see Fig. 3.15). In the leeward-side curve the effect is not visible. The temperature at the leeward-side symmetry line is almost
![The Computed Radiation-Adiabatic Temperature Field Подпись: Heat flux < kJ/(e*m**2)> Teroperatur < К > Fig. 3.21. Computed skin-friction lines, and distributions of the surface radiation heat flux qrad (left) and the radiation-adiabatic surface temperature Tra (right) at a) the lower (windward) side, and b) the upper (leeward) side of the BDW [34].](/img/3130/image121_4.gif)
constant with approximately 650 K. At the windward side we find only very approximately the flat-plate behavior suggested by eq. (3.20), i. e., the drop of Ta ж (x/L)-0-5. This is due to the up to x/L « 0.34 first slightly convergent and then divergent skin-friction line pattern at the windward symmetry line, Fig. 3.16.
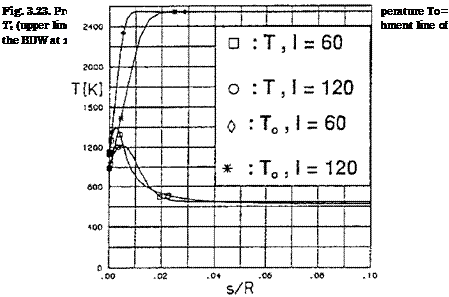
A look at the temperature profiles of the primary attachment line in direction nearly normal to the surface at x/L = 0.14 and 0.99 shows very steep gradients of both the static temperature (T)—dT/dngw—and the total temperature (Tt)—dTt/dngw—, Fig. 3.23. The total temperature of the
|
Fig. 3.22. Computed distribution of the radiation-adiabatic surface temperature Tra at the windward (A) and the leeward (*) symmetry line of the BDW (I is the surface parameter) [34]. |
free-stream is Tt = 2,542.35 K. The curves for the total temperature indicate a thicker boundary layer at the aft location. The curves for the static temperature seem to indicate a thinner boundary layer there. Fig. 3.16 shows more or less an infinite-swept wing situation at the primary attachment lines (the leading-edge radius is constant).
The contradictory data may be due to the fact, that the data are taken from a coordinate line, which is not a locally monoclinic line [18]. In any case the behavior of the static temperature near to the wall supports the assumption made in eq. (3.15) regarding the appropriate characteristic length of the laminar boundary layer (A = St) for the analysis of the radiation-adiabatic temperature. However, since no computation was made with an adiabatic wall, no information is available about the recovery temperature at the attachment line. Eq. (3.7) for the recovery temperature is approximately valid only for flat surfaces. At attachment and separation lines strong departures can be observed from the data found with that equation [18], so that it is only of restricted value here.
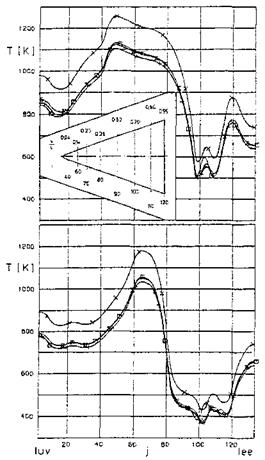
In Fig. 3.24 we present results of a scaling of the distribution of the radiation-adiabatic temperature at the two locations x/L = 0.14 and 0.99.
For the purpose of scaling a Navier-Stokes solution was made also for the wing with a length L = 4.67 m. All other parameters were the same, so that the scaling relation (3.33) can be reduced, with n = 0.5, and Tri = Tr2, to
1
 |
Tral
Tra2
The results in Fig. 3.24 are given in the computation-grid parameter space j, Fig. 3.15. At the left side of the abscissa (“luv”) we are on the lower symmetry line (windward side) (j = 2), at j = 70 at the leading edge, and at the right hand side (“lee”) on the upper symmetry line (leeward side) (j = 134).
The general pattern of the temperature distributions is discussed in the following, while taking into account also the patterns of the skin-friction lines in Figs. 3.16 to 3.18. At the lower symmetry line lies a weak relative maximum, followed by a plateau, which has a large width at x/L = 0.99, and a small one at x/L = 0.14. The smallness of the latter is due to the fact, that the primary attachment line lies at a constant distance from the leading edge. This is also the reason, why the temperature maximum (attachmentline heating) on it lies at approximately j = 48 and in the aft location x/L = 0.99 at j = 65.
At the leeward side again we have a small plateau at the first location and a wide one at the second. Around j = 100 we see the cold-spot situation at the primary separation line, followed by the hot-spot situation at the secondary attachment line. This attachment line lies in the forward location at j « 105
|
Fig. 3.24. Scaling of radiation-adiabatic surface temperatures at x/L = 0.14 (upper part of the figure) and x/L = 0.99 (lower part of the figure) of the BDW [34]. x: numerical solution for L = 4.67 m, □: numerical solution for L = 14 m, V: result of scaling with eq. (3.42), +: results of scaling with modified eq. (3.42). Lower symmetry line: j = 2, leading edge: j = 70, upper symmetry line: j = 134. |
and in the aft location at j « 110. The cold-spot situation in the secondary separation line follows at j « 110 at the forward location, and in the aft location, despite its off-tapering, at j « 117. At the second location the hotspot situation at the tertiary attachment line in the leeward-side symmetry line is well discernible. In the first location a hot-spot situation lies at j = 120 with a temperature distinctly higher than that in the symmetry line.
The reason for that is not fully clear. In Fig. 3.21 (and also in Fig. 3.18) we see that the skin-friction lines in that region bend very strongly out of the tertiary attachment line. Also a local maximum is discernible in the radiation heat flux parallel and close to the symmetry line. A cross-flow shock in that area, if it is sufficiently oblique, see Section 6.6, would lead to a thinning of the boundary layer downstream of it. Most probably this is the cause for the phenomenon, since the temperature level in the symmetry line there is already that found at x/L = 0.99.
The scaling with eq. (3.42) for design purposes would give very good results. Almost all phenomena are at least qualitatively and quantitatively well reproduced. At the leeward side small differences can be seen regarding the location and the magnitude of the cold – and hot-spot situations.
From the qualitative results given in Section 3.2.1 it can be deduced that at a radiation-cooled flight vehicle the radiation-adiabatic surface temperature is higher on the windward side than on the leeward side, which is supported by the computed data shown in Figs. 3.22 and 3.24. This temperature differential is due to the fact that the boundary layer thickness is smaller on the lower and larger on the upper side of the vehicle.
We demonstrate this with data for an infinitely thin flat plate at angle of attack. For M= 7.15 and a = 15° the ratio of the (constant) unit Reynolds numbers at the leeward (l) side and the windward (w) side is Ref /Reff ~ 0.09. This amounts to a ratio of the boundary-layer thicknesses, without taking into account the surface temperature, of 5i/5W « 3.33. Using the scaling relation (3.35) we find a ratio of the temperatures of the leeward side and the windward side Tra, l/Tra, w « 0.74. Of course we must be careful with a comparison because of the hot – and cold-spot situations at the upper side of the BDW. Nevertheless, when comparing this ratio with the ratio of the computed data at the two stations of the BDW, x/L = 0.14 and x/L = 0.99, or with the ratio of the computed data in Fig. 3.22, we see that this result illustrates fairly well the temperature differentials, which we find on hypersonic vehicles flying at angle of attack.


