Separation
The quality of the different turbulence models to predict the correct position of a separation is very variable. This has a great influence on the correct prediction of the drag and lift coefficients. For the investigation the 2D test-case Onera-A at13.3 angle of attack was chosen. The test-case has a separation at 89.5% chord-length on the suction side with Re = 2.1e6 and Ma = 0.15. The grid consists of 530,000 grid points (fig. 10) and was already tested on grid convergence in the ECARP-project. The order of convergence of the turbulence models differs slightly, but the results should also be comparable.
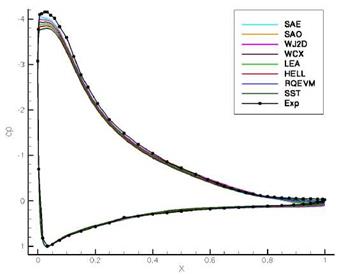
The variation of the turbulence models leads to visible variations in the separation position and also to different levels in Cp and Cf (fig. 11 & 12). Compared to the experiment the deviations are 8.9% in the lift and up to 73.62% in the drag coefficient (SST). This strong deviation in the drag coefficient is in part due to the fully-turbulent computations applied: A user-specified transition location is known to ignore results for this test case. The range of variation in the forces reaches
|
|
|
|
|
|
Fig. 11 ONERA-A — pressure coefficient Cp in comparision with the eight different turbulence models and the experiment |
|
Table 1 ONERA-A – lift and drag coefficient, position of pressure induced separation compared to experimental results
|


