THE PHYSICAL MECHANISM OF STALLING
The stall of an airfoil depends on the section shape, thickness ratio and the operating Reynolds number. The flow along the pressure side of the airfoil section is of little importance with regard to maximum lift. On the other hand, as the angle of attack is increased the flow past the suction side develops:
a) A negative peak in the pressure distribution at or near the leading edge
b) A strong positive pressure gradient between the negative pressure peak and the trailing edge
c) A growth of the boundary layer thickness along the chord.
|
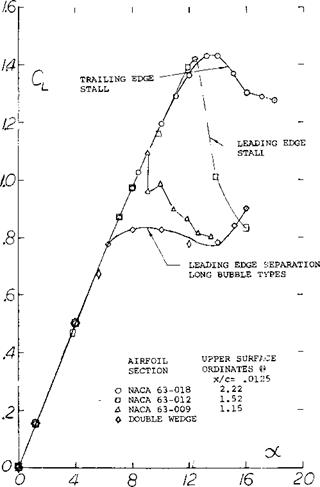
Figure 2. Types of airfoil stall Reynolds number 5.8(10)^, TN 2502. |
With an increasing angle of attack of the section the flow on the suction side of the airfoil develops two weak spots where boundary layer separation is to be expected:
1) At the leading edge where the flow must go around the nose section with a corresponding loss of momentum
2) Near the trailing edge where an increase in the boundary layer thickness takes place.
Stalling (loss of lift due to flow separation) will originate in one of the two locations, or in both concurrently.
Types of Lift Stall The lift stall encountered by an airfoil as a result of separation has been classified into three different types:
1) Leading Edge Separation — Long Bubble Type. This is a gradual stalling of thin sections from a more or less sharp edge by way of a laminar separation bubble and reattachment.
2) Leading Edge Separation — Short Bubble Type. Sudden stall is encountered with round nose zero or low camber sections with so-called bubble bursting.
3) Trailing Edge Separation. Gentle stalling from separation at the trail edge is experienced with this type. As the stall increases the separation progresses forward from the trail edge.
Each of the above types of stall has a distinct behavior as characterized by the variation of lift as a function of angle of attack, figure 2.
The lift characteristics of a double wedge section, figure 2, illustrates leading edge stall of the long bubble type. Here the variation of lift with a is linear nearly to the maximum and then rounds and continues flat. When lead edge separation of the short bubble type is encountered the lift remains linear to the stall and then drops suddenly as illustrated by the NACA 63-009 section, figure 2. Trailing edge separation is encountered typically with thicker, more rounded nose airfoils, such as the NACA 633 -018 type also shown on figure 2.
Thin (Sharp) Leading Edge. The reason for the leading edge separation of the long bubble type is explained by considering the pressure distribution for the wedge section operating at oc = 6 , figure 3. The flow does get around its sharp leading edge up to angles of attack for a lift coefficient in the order of CL = 0.7. The mechanism through which this is possible, is as follows: Corresponding to the small distance between stagnation point (at the lower side) and leading edge, the boundary layer arriving at that edge, is very thin. The Reynolds number of the flow at the leading edge is also very small. Taking into account the strong negative pressure gradient between stagnation point (where Cp = +1) and the leading edge (where C p possibly = —10) the boundary layer flow
must certainly be assumed to be laminar; and since it is laminar, the flow “around” a sharp leading edge must be expected to separate “immediately”. As confirmed by several special investigations (2), laminar separation does take place. However, after separating, the inside surface of the fluid forming the contour of the separated space, turns turbulent. As shown in figure 3, the boundary layer (the sheet of air adjacent to the bubble) then expands in volume because of mixing with the “dead” material in the separated space, thus reducing the size of that space, until the outer flow (including the now thickened boundary layer) re-attaches itself to the upper surface of the plate at some distance behind the leading edge. The presence of the separated space is recognized (as in figure 3) in the pressure distribution showing a constant negative pressure region, where without the “bubble” a pronounced peak should be. The peak is thus cut off by separation, although some of its lift is added further downstream.
Boundary Layer Transition. At higher Reynolds numbers (above 2 or 3 times 10Б ) it can be assumed that laminar separation and the formation of the bubble are reduced, and that re-attachment of the flow is facilitated by camber and thickness (nose radius). The whole bubble mechanism still persists, however, at least under certain conditions, in round-nose sections, although the size and development of the separation bubble may be very limited, and as a consequence the magnitude of the Clx is different. For example, in the 64A010 section reported m (2,b) the chordwise dimension of the bubble is but 0.5% of the chord at Cl = 1.0. For practical purposes, the sequence of such minimal separation plus “immediate ’ re-attachment, obtained within the first 1% of the chord, simply constitutes the transition of the boundary layer from the laminar to the turbulent type of flow. Such transition is susceptible to stream turbulence (as ir certain wind tunnels) and to variations of the Reynolds number (3). The maximum lift coefficient increases, therefore, due to turbulence as well as to increasing the Reynolds number. Airfoil sections of this type are very numerous. Among them are the symmetrical NACA 0012 r. o 0021 shapes, and most of the sections with modest thickness and camber dimensions such as the NACA 2409, 23012, and 64-212.
Bubble Bursting. Leading edge separation of th e short bubble type is encountered when the angle of attack of a section is further increased without a further growth of the separation bubble in fact, as documented in(2,b, c,d), the length of the very small bubble (found at higher Reynolds numbers) reduces as the angle of attack is increased. In this condition, the lift continues to grow, essentially along a straight line versus the angle of attack, with hardly any losses. Figure 2 demonstrates this type of lift function very well for the NACA 63-009 airfoil section. However, without any warning, upon reaching a critical condition in which the bubble is strained too much, “complete” separation takes place from near the leading edge. As noted in (2,a) the bubble thus “bursts” into separation (re-attachment fails suddenly). The lift coefficient drops at the same instant, from a maximum to a level which seems to be of the same type as in л stalled thin airfoil section.
Trail Edge Stalling. After eliminating (by using a round nose, increased thickness and/or camber) the flow near the leading edge as the weakest part of the circulating motion of the fluid, another weak region soon develops near the trailing edge. For example, consider the pressure distribution of a 4% cambered airfoil section shown in figure 5,a. On the suction side, three pressure distributions are superimposed:
(a) a component due to thickness
(b) a distribution representing lift due to camber
(c) a peaked contribution due to flow around the nose
|
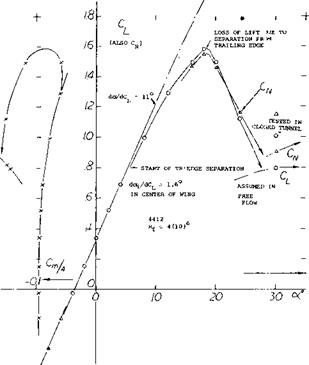
Figure 5. Lifting characteristics of a 4412 section tested (4,e) (5) on the center line of an A = 6 airfoil in the VDT tunnel at Rf = 4(10)fc. a) pressure distribution at an angle of attack slightly beyond that for Cux • |
![]()
(3) Regarding the strong effect of transition and/or R’num – ber upon the elimination of laminar-type separation, the mechanism of the drag of spheres may be consulted as described (for example) in Chapter III of “Fluid – Dynamic Drag”.
Evaluation of (5,b) roughly yields the ratio of the maximum local velocity “w”, at the nose of average symmetrical foil sections:
w/V»l + 2 t/c + 0.2 Cl/(r/t) (1)
where r/t, the ratio of lead edge radius to thickness, may be between (0.5 and 2.0) t/c. Maximum speed w, maximum dynamic pressure q and the minimum pressure coefficient can be estimated using this equation. Both items
(a) and (b) above produce a positive pressure gradient approaching the trailing edge. Under the influence: of this gradient, the boundary layer grows considerably; and at the trailing edge will have a total thickness <5 which can roughly be described by
S/c = 5C. f +k(CL)n (2)
where Cf = skin friction drag coefficient, n possibly = 2, к in the order of 10, and Cf = 0.03, depending on the thickness and shape of the section used. After growing so much, the boundary layer reaches a critical condition (where it cannot keep moving against the pressure) so that a gradual accumulation of boundary layer material and a corresponding separation of the outer flow from the surface of the foil section take place. The circulation then stops growing with the angle of attack; the lift reaches a maximum.
|
Figure 5. b) Сц (and CN) integrated from pressure distributions on center line of A = 6 airfoil. |
As shown in Figure 5,b, the NACA 4412 airfoil displays a rounding-over lift function. Thus, before reaching its maximum, the lift coefficient diverges from the straight line indicating the beginning of flow separation from the trailing edge. Upon increasing the angle of attack beyond that for Clx, the lift decreases gradually (and without discontinuity) eventually reducing (at very high angles of attack) to a level or a function corresponding to “full” separation. It should be emphasized that separation in sections of this kind, proceeds from the trailing edge toward the leading edge; and that stalling from the leading edge is only obtained at the very high angles mentioned.
|
Ш at 1q5 laminar separation |
|
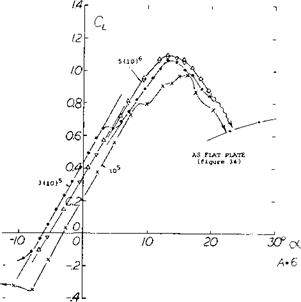
Figure 6. Lift characteristics and mechanism of stalling of a 10% circular-arc section as tested (6,d) at three different Reynolds numbers, in the British Compressed Air Tunnel (A = 6). |
Circular Arc Sections. The mechanism and details of trail – ing-edge stalling have not been studied as much as leading-edge stalling. Some further insight can be gained, however, by considering the data for the circular-arc section shown in figure 6. The well-defined characteristics of essentially sharp-edged plates change to a degree as a sufficient amount of thickness is added, particularly in the form of an arched “back”. Keeping the lower side flat, their camber ratio is equal to lA the thickness ratio. With maximum thickness located at 50% of the chord such sections have a considerable trailing edge “wedge” angle “at” the suction side, easily leading to separation from that edge. In other words, thickness, camber and the location of these two at 50% of the chord, combine to make the flow along the suction side comparatively sensitive and weak as it approaches the trailing edge. Specific characteristics of the circular arc section of figure 6 are as follows:
5
(a) At a Reynolds number of but 10 (in the comparatively turbulent CA’tunnel) laminar-type separation seems to take place from the minimum-pressure point at or somewhat ahead of the 50% chord point. At this condition the minimum drag coefficient is 0.02, confirming separation.
(b) At Rc = 3 (10)[39] and the angle for minimum drag the lift coefficient is 0.575, which is equal to the potential flow theory Ci_ syrr>= 0.575, as in figure 27, of Chapter II, for f/c = 0.5. The drag coefficient (Cos = 0.008 = minimum) obviously confirms that the flow is fully attached and we have the condition of symmetrical flow.
(c) Upon increasing the Reynolds number above 3 (10/ , the lift coefficient for minimum drag reduces slowly; and becomes CL0 = 0.46 at 5(10)^ . An increase of skin friction more turbulent along the upper side of the section (CDS = 0.009) is evidently responsible for reduced boundary-layer momentum approaching the trailing edge. As a consequence, pressure recovery is somewhat deficient, and circulation and lift are somewhat reduced.
Zero-Lift Angle of Attack. The lift-curve slopes shown in figure 6 are practically the same at all three Reynolds numbers considered. However, the zero-lift angle of attack varies from —3° at a Reynolds number of 105, up to a maximum of —60° at RN = 3 x 10⁵, and slowly down again to —5 at RN = 5(10) . This variation of the zero lift angle corresponds to that of the skin-friction drag coefficient, down from the laminarly separated value at 10 5 , to a minimum part laminar and part turbulent value in the vicinity of 3(10)5, and somewhat up again to a mostly turbulent level at 5(10)5 . We can also make the prediction that skin friction would decrease again, and that lift would increase again, upon increasing Reynolds number above about 10[40] , provided that neither surface roughness nor compressibility would interfere. It should be noted that all these variations are a consequence of beginning trailing edge stalling. The report (6,d) from which the results in figure 6 are taken, also contains data on circular-arc sections with different thickness ratios (while f/c always = 0.5 t/c). Sections with ratios t/c = 15 and 20% show the variations as discussed above in stronger form, while a 5% section does not show much of a variation at all.
!
c4) Airfoil sections as a function of R’number:
a) Jacobs, In VDT, NACA T Rpt 586 (1937).
b) Relf, In the British CAT, ARC RM 1706 (1936».
c) See references (7,a) (11 ,c).
d) Jacobs, Thick Sections in VDT, T Rpt 391 (1931).
e) Pinkerton, 4412 Pressure Distribution, NACA TR 613
(1938).
0 AVA Gottingen, Ergebnisse III (1920) p. 58.
a) Pinkerton, 4412 Distribution, NACA T Rpt 612.
b) Kochanowsky, Theoretical, Ybk I) Lufo 1940 p.
1-72.
c) Schrank, Collection of Data, Ringbuch Luft Tech,
Rpt IA11 (1938).
Rounding of Leading Edge. The report (6,d) also gives an explanation for the fact that sharp-edged circular arc sections (as frequently used in marine propellers) do have the same efficiency as similar sections with rounded noses where, and if, used at lift coefficients close to Clsy/ti – However, when using the section of figure 6, at a lift coefficient of 1.0, the section-drag coefficient, of a suitability rounded foil shape (with r/c between 1 and 2%) is but half (CD5 ^ 0.017) of that of the original sharp – edged section (Cqs = 0.038) at Rc = 4 (10)[41] . Rounding also has an effect upon the maximum lift coefficient of the sections tested at Reynolds numbers above (2 or 3) 10 . When rounded, the 10% section (as in figure 6) thus exhibits a maximum CLy. = 1.55, at R = 4 (10)6 , rather than ^ 1.10 as at lesser Reynolds numbers, or as in the original condition (with sharp leading edge).


