TAIL-BUFFETING BOUNDARIES
Since tail buffeting is associated with flow separation over parts of the airplane ahead of the tail, it can be avoided by keeping the operation attitude of an airplane below the separation limits.
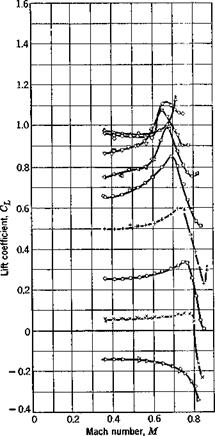
Figure 9.2 shows a plot of the lift coefficient versus the Mach number at various angles of attack of an NACA 2409-34 airfoil.9-15 It is seen that, at each angle of attack, the lift coefficient increases with increasing Mach number until a maximum is reached; then it drops sharply with further increase in speed. This drop is associated either with a strong shock-wave formation or with flow separation. The airfoil is said to be shock-stalled when severe drop of CL occurs.
At lower Mach number, Fig. 9.2 shows that a maximum CL is reached at certain angle of attack. This angle (of the order of 12° for the NACA 2409-34 airfoil) is the stalling angle in the usual sense.
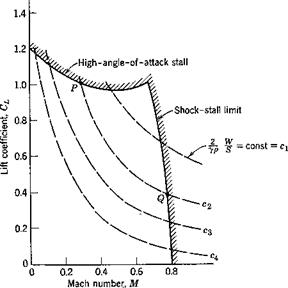
When the high-angle-of-attack stall and the shock-stall limits are plotted together, a figure showing the boundaries of the lift coefficients beyond which stall occurs is obtained (Fig. 9.3).
It is known that stall at high angle of attack is associated with flow separation. But a shock wave does not necessarily initiate complete breakoff of the flow from the airfoil. Moreover, high angle of attack and high speed of flow are not the only causes of separation. Improper fillets at the
|
|
wing-fuselage junction, etc., cause separation readily. Thus for a given airplane, the boundaries indicating the onset of separation cannot be determined from the wing alone.
Nevertheless, for a given airplane, a boundary on a CL vs. M chart can. be determined which separates the region of possible tail buffeting
from that of a smooth potential flow. Such a tail-buffeting boundary (see, for example, Fig. 9.4) resembles in appearance the stall boundary of Fig. 9.3. It is determined by flight testing.916
It should be noticed that two curves are shown in Fig. 9.4, which gives the buffeting boundaries for the horizontal tail of a fighter-type airplane that has a low-drag wing section. One curve, labeled “abrupt pull-ups” was obtained by pulling up the airplane abruptly at various altitudes and Mach numbers, the degree of abruptness being limited by the inertia,
|
Fig. 9.3. Stall boundary of the NACA 2409-34 airfoil (steady- state wind-tunnel tests). |
control power, and the stability of the airplane. The other curve was obtained by gradual stalls made in turns. The difference between these two curves indicates the effect of the rate of change of angle of attack on the flow separation, which will be discussed further in Chapter 15. For the test airplane from which Fig. 9.4 was obtained, buffeting of the horizontal tail in abrupt pull-ups occurred simultaneously with the attainment of maximum normal force at Mach numbers below about 0.64 (solid curve in figure). Above this value of Mach number, tail buffeting in abrupt pull-ups occurred before the attainment of the maximum normal force (dotted curve). In the range tested, altitude, and hence the Reynolds number, had no effect on the tail-buffeting boundary determined in abrupt, pull-ups.
Fig. 9.4. Buffeting boundaries obtained in abrupt and gradual stalls for a test airplane. The airplane normal force coefficient CNA is defined as the ratio n IVKqS), where n is the load factor, i. e. the airplane normal acceleration measured at the center of gravity expressed as multiples of the gravitational acceleration. W is the airplane gross weight, q is the dynamic pressure, S is the wing area. The normal force (perpendicular to thrust line), rather than the lift (perpendicular to relative wind direction), is used because it is more convenient to be defined and measured in transient conditions. In steady flight Слл = CL. Flight measurements by Stokke and Aiken, Ref. 9.16.
(Courtesy of the NACA.)
Since in horizontal steady flight the lift L balances the weight W of the airplane, we have
W — L — pU*SCL (1)
![]()
![]() Hence, in terms of the Mach number,
Hence, in terms of the Mach number,
W_ 2_ __ W 2 8 pa2 S
where a denotes the speed of sound, p denotes the static pressure, and у = CJCV denotes the ratio of specific heats at constant pressure and constant volume.
Thus the relation between the lift coefficient and the Mach number depends on the wing loading W/S and the static pressure p, which in turn depends on the altitude z. A curve showing the relation 2 appears as a dotted line in Fig. 9.3. When such curves are plotted on Fig. 9.4, the permissible range of airplane flight speed as limited by tail buffeting will be given by the intersections of the tail-buffeting boundaries with these curves. Since the atmospheric pressure p decreases with altitude, it is seen that the permissible range of flight speeds becomes narrower as the altitude increases. The segments of the M2CL = const lines between the tail buffeting boundary indicate the maneuverability of the airplane as far as tail buffeting is concerned. Clearly, it decreases with increasing altitude.


