Transitional separation bubbles
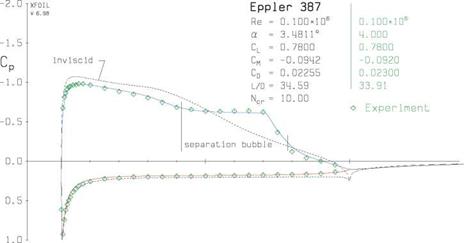
In a sufficiently clean flow and at a sufficiently low Reynolds number, natural transition will occur after laminar separation takes place. Past transition, the now-turbulent separated shear layer is able to reattach, forming a transitional separation bubble (also called a laminar separation bubble), originally investigated by Tani [40] and Gaster [41]. An example of such a flow is shown in Figure 4.34, in which a separation bubble is revealed by the pressure plateau over its laminar portion, followed by a rapid pressure rise over the turbulent portion after transition. The plateau is a consequence of the nearly-still fluid inside the laminar part of the bubble being unable to sustain any significant pressure gradients. In contrast, the strong turbulent mixing in the turbulent portion can support the strong adverse pressure gradient.
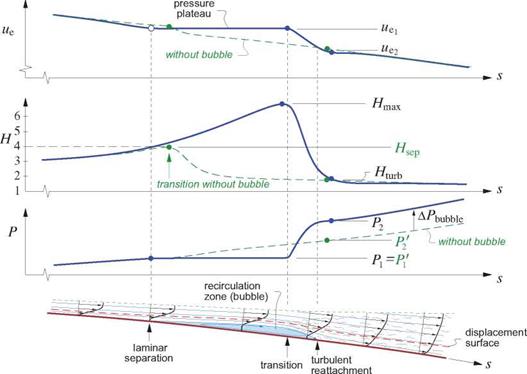
Figure 4.35 diagrams the overall separation bubble flow, together with its associated edge velocity ue(s), shape parameter H(s), and momentum defect P(s) distributions. The steep velocity decrease from uei to ue2 over the turbulent portion results in an associated steep momentum defect increase from Pi to P2. Since skin friction is largely negligible in a separation bubble, these changes are related by the wake form of the
|
|
|
Figure 4.34: XFOIL [5] pressure distributions on Eppler 387 airfoil at Re = 100 000 reveal a transitional separation bubble on the upper surface. Experimental data is from McGhee at al [42]. |
von Karman momentum equation (4.116).
P2 ~ Pi ^ ^ (4.127)
Ue2
where i? avg — 5(Pmax + Pturb) is an average shape parameter over the velocity change interval. Large Hmax values in the bubble will therefore increase Havg and increase the downstream defect P2.
The smallest-possible downstream defect, denoted by P2 in Figure 4.35, is obtained when transition occurs close to laminar separation so that the bubble does not form and Havg stays very low at its turbulent value. The difference
APbubbte = P2 – P2 (4.128)
can be considered to be “bubble drag,” or the drag penalty of the bubble being present.
The excess APbubbie from large Hmax values persists into the far wake and implies a corresponding increase in the overall profile drag D’, referred to as bubble drag. This is the mechanism responsible for the inordinate drag increases experienced by most airfoils which are operated well below their intended Reynolds numbers, which results in strong separation bubble formation.
Reducing separation bubble loss APbubbie is one of the major design goals for airfoils at low Reynolds numbers, below 250000 or so. A specific objective is to make Hmax as small as possible and also uei/ue2 as close to unity as possible, while still maintaining the transition point at the ideal location. This is achieved via a suitable transition ramp, which is a region of weak adverse pressure gradient in the inviscid velocity ueiNV (s) ahead and over the bubble, which encourages instabilities but is too weak to produce early laminar separation. Once separation does occur, the weak inviscid adverse pressure gradient also gives a modest H(s) growth in the bubble, so Hmax at transition is modest as well. Furthermore, the longer weak adverse gradient reduces the velocity uei at transition, so that the velocity ratio uei /ue2 is smaller as well. Both effects are seen to decrease the downstream defect P2 in equation (4.127).
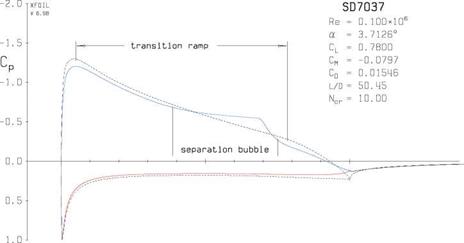
Figure 4.36 shows the SD7037 airfoil with features a transition ramp starting at 5% chord. The result is a 32% drag reduction compared to the Eppler 387 airfoil in Figure 4.34 which has a shorter and steeper
|
Figure 4.35: Transitional separation bubble is produced when laminar separation is followed by transition and subsequent reattachment. The excess momentum defect increase APbubbie due to a large Hmax is a bubble drag penalty. |
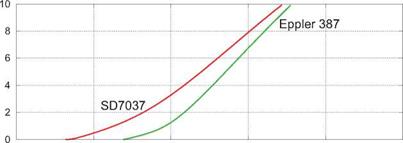
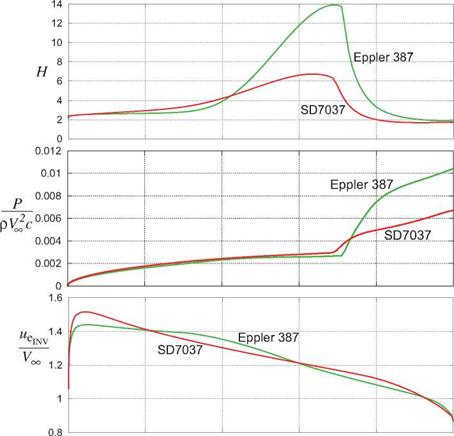
transition ramp starting at 35% chord. The relevant boundary layer parameter distributions for the two airfoils are compared in Figure 4.37. The Hmax value is seen to be smaller for the SD7037. Comparing the Cp(x) distributions between Figures 4.34 and 4.36 reveals that the SD7037 has a noticeably smaller Cp jump between transition and reattachment, so its uei/ue2 ratio is smaller as well.
|
|
|
Figure 4.36: XFOIL [5] pressure distributions on SD7037 airfoil at Re = 100 000, which features a long transition ramp (weak adverse pressure gradient) starting at x/c ~ 0.05 to reduce bubble loss. |
A long bubble ramp requires a reduction in the overall airfoil thickness, which influences the structural merit (maximum spar thickness) and other properties such as cm and off-design performance, making the overall airfoil design problem quite complex. These various design considerations are discussed in more detail in the low Reynolds number airfoil design studies by Drela [43], Liebeck [44], and Selig [45]. Control of separation bubbles using intentional boundary layer trips is discussed by Gopalarathnam et al [46].
|
|
|
|
0 0.2 0.4 , 0.6 0.8 1
x/c
Figure 4.37: Upper surface inviscid edge velocity distributions and resulting shape parameter and TS-wave envelope distributions for SD7037 and Eppler387 airfoils. Long and shallow transition ramp in the ue(x) distribution of the SD7037 airfoil produces a smaller maximum H value and a smaller ue decrease over the bubble. The result is a much smaller rise in the momentum defect P past transition at x/c ~ 0.7 for the SD7037 compared to the Eppler387. The SD7037 has 32% less drag as a consequence.


