Low-Density Effects
Low-density effects, also called rarefaction effects, occur, if the flow past the hypersonic flight vehicle under consideration—or a component of it—
is outside of the continuum regime, Section 2.3. We have seen in Fig. 2.6, that the hypersonic flight vehicles of the major classes (RV’s and CAV’s) are flying essentially in the continuum regime, at most approaching the slip-flow regime. Therefore we will here only touch the topic of low-density effects. We give some references for a deeper study, show some results connected to the results of the flat plate case shown in Figs. 9.22 to 9.24 of the preceding section, and discuss shortly issues of the viscous shock layer at blunt bodies.
Reviews of and theories about the transition from continuum flow to free molecular flow, especially regarding the intermediate regimes, Section 2.3, can be found in, e. g., [47, 60], [61]—[63].
We have seen in the preceding section that at an infinitely thin flat plate the strong interaction limit lies just downstream of the shock-formation region. We assume that the Navier-Stokes equations are valid in this region, although with slip-flow boundary conditions, Section 4.3. This means, that we have to demand Kn ^ 0.1, Section 2.3. For viscous layers with the thickness 6 in [60] the condition
0.01 < /чи ‘ < 0.1 (9.42)
is proposed.
For Моо/х/Деg/ 0.1 the continuum regime is left. Therefore the part of the flow just downstream of the leading edge, which is marked as “transition regime” in Fig. 9.20, in principle cannot be described by the Navier-Stokes equations.[167]
The fraction in eq. (9.42) is also called rarefaction parameter V:
v = -2b=, (9.43)
Re<x>,x
which together with the Chapman-Rubesin constant Creads
‘ ”.У’. (9.44)
Re<x>,x
which we already met in the preceding section.
H. K. Cheng proposes a Chapman-Rubesin constant [64]
Coo = ^ (9.45)
with the reference temperature
T* = (Tt + ZTw)1 (9.46)
6
which he found from experiments and Monte Carlo simulations. He gives for the end of the slip-flow or shock-formation region V « 0.1, and for the (upstream lying) end of the transition region, where the validity of the Navier – Stokes equations begins, V «0.4.
Now back to the example in the preceding section. The length of the shock-formation region was determined with the criterion [52]
![]() ^ (Vй)2
^ (Vй)2
sfr ~ 0.12 to 0.32 ’
with Vй = M, xy/C^/^Re%.
![Low-Density Effects Подпись: Fig. 9.25. Non-dimensional wall slip velocity uw (x) [49]. For the symbols see Table 9.7. x = 1 is Lsfr = 6.676 cm downstream of the leading edge, Table 9.6.](/img/3130/image826_3.gif) |
At the end of the shock-formation region the wall slip velocity uw is supposed to be nearly zero. Actually it reaches zero only asymptotically, as we see in Fig. 9.25, where uw is non-dimensionalized with uTO.
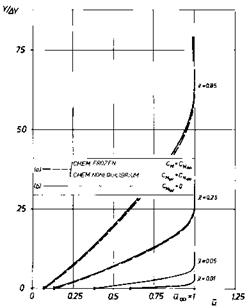
A visualization of the slip-flow profiles along x is desirable. Because we have no such profiles available from [49], we show them from another study [48], Fig. 9.26. Gas, Mach number and unit Reynolds number are different. The lengths of the shock-formation layer are Lsfr = 6.676 cm (x = 1 in Fig. 9.25) and Lsfr = 46 cm in Fig. 9.26 (x = x/Lsfr). If one scales accordingly the results from Fig. 9.26 into Fig. 9.25, a fair agreement of the wall slip velocity is found.
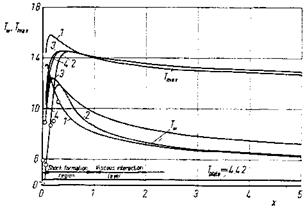
Back to the case shown in Fig. 9.25. We observe that also the wall temperature jump only approximately approaches zero, Fig. 9.27, which reflects
|
Fig. 9.26. Slip-flow boundary-layer profiles и (у/Ay) at different downstream locations x on a flat plate [48]. = 11.18, Re^ = 92.08 m-1, Tw = 292 К, Ab. |
|
Fig. 9.27. Non-dimensional static wall temperature Tw(x) and maximum static temperature Tmax(x) in the viscous layer [49]. For the symbols see Table 9.7. |
the results given in Fig. 9.24 (the temperatures are non-dimensionalized with Tro). The temperature of the gas at the wall initially is much larger than the wall temperature.
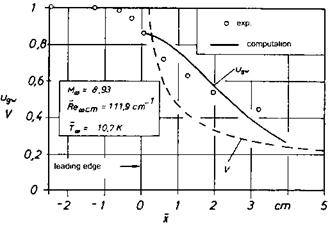
In closing this topic we discuss now some experimental [65] and numerical [66] results for the transition region, in particular the highly rarefied hypersonic flow of helium past an infinitely thin flat plate, Table 9.8, which of course in the experiment is realized as plate of finite thickness with a sharp leading edge.[168] From the graph of V (= V) in Fig. 9.28 we see that the Navier-Stokes equations are valid only for x ^ 1.5 cm, if we apply the criterion of H. K. Cheng: V 0.4. The end of the shock-formation region, V « 0.1, lies at approximately x = 22 cm, outside of the scale of Fig. 9.28.
|
Table 9.8. Free-stream parameters of the hypersonic flat-plate helium flow [65].
|
|
Fig. 9.28. Comparison of the experimentally determined [65] and computed [66] slip velocity near the leading edge of a flat-plate. ugw is the with unon- dimensionalized slip velocity, V denotes the rarefaction parameter V, о are experimental data. |
In the experimental data we see clearly an upstream influence of the plate’s leading edge. The initial data for the computation were taken from measured flow profiles, but obviously they are not consistent, because uw does not decrease monotonically with x as it should be expected.
The accommodation coefficients employed in the computation [66] for the tangential momentum, a, and for the energy, a, were derived in [65] with the help of second-order conditions [67]. They are initially small and increase with increasing x, and show partly wrong tendencies. This is probably due to the fact, that at the large degree of rarefaction in the leading-edge region no Maxwellian distribution exists. Hence the mean free path Xgw at the surface of the plate is only approximately representative for the determination of the accommodation coefficients.
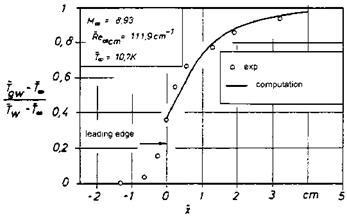
The computed temperature jump, however, compares rather well with the experimental data, Fig. 9.29. Near the leading edge the computed data are somewhat smaller than the measured data, which also points to inconsistencies in the initial data. Further downstream the solution also away from the plate’s surface shows some deficiencies despite the good agreement at the wall
|
Fig. 9.29. Comparison of the experimentally determined [65] and computed [66] wall temperature jump near the leading edge of a flat-plate. Tgw is the temperature of the gas at the wall, Tw the surface temperature of the flat plate, Tthe static free-stream temperature, о are experimental data. |
We conclude that the transition from the disturbed molecular flow regime to the slip-flow regime at the flat plate can approximately be described with the help of the Navier-Stokes equations. However, depending on the problem at hand, the validity of such an approach must be verified.
The counterpart of the flow past an infinitely thin flat plate is the flow past a blunt body. We are interested in the front part of the blunt body. Here two Knudsen numbers are to be considered [68]. The first is formulated in terms of the bow-shock stand-off distance A0, Fig. 6.19, and the second
in terms of the boundary-layer thickness S. As long as for both Knudsen numbers holds
![]() Kns = ^ < 0.01,
Kns = ^ < 0.01,
Ao ~ ’
and
Knbl = ^ < 0.01, (9.49)
S
the flow at the front part of the blunt body is a continuum flow. Of course, then also S < Aq.
We have noted before that a shock wave has a finite thickness of a few mean free paths, say Ss « 8 ATO, see Fig. 6.17 in Sub-Section 6.3.3. We are in the slip-flow regime, if either
0.01 < Kns < 0.1, (9.50)
or
0.01 < Knbl < 0.1. (9.51)
In this regime the boundary layer will be no more thinner than the shock layer/shock stand-off distance
S < 0(Aq), (9.52)
which holds also for the bow-shock wave
Ss < O(Aq). (9.53)
At still larger Knudsen numbers the shock layer ahead of the blunt body becomes a “merged layer”. In analogy to the shock-formation layer at the flat plate, the merged layer regime at the blunt body is defined by both a non-distinguishable bow-shock wave and a non-distinguishable boundary layer, the latter with slip-flow and temperature jump at the body surface. The Rankine-Hugoniot conditions are not valid in this case.
The flow field in the slip-flow regime is also called “viscous shock layer” [69]. It encompasses the thick boundary layer with Navier-Stokes slip-flow conditions, see, e. g., [70] and an inviscid flow portion between the bow-shock wave and the boundary layer.[169] The “thick” bow-shock wave is still considered as a field discontinuity, however, shock-slip conditions must be applied [69, 71].
Viscous shock layers can be described by a system of governing equations of parabolic/hyperbolic type in space. Numerical methods based on these
equations are a cheap alternative to the Navier-Stokes methods, although their applicability is limited, see, e. g., [72].
Slip flow and temperature jump, at least at blunt bodies with cold surfaces, are usually small. However, the wall pressure can appreciably be affected by low-density effects. Approximate theories as well as experimental data about blunt and other bodies in the slip-flow regime can be found in, e. g., [47, 60, 68].
9.3 Problems
Problem 9.1. In Fig. 9.18 a reference pressure coefficient cP0 = 1.8275 is given. How large is the coefficient at the stagnation point, cPs, of the blunt body (symmetric case, perfect gas) for Мо = a) 8.03, b) to? Assume perfect gas. Why are these values so close to each other. Formulate the principle in the background.
Problem 9.2. Assume that cp of Problem 9.1 can be considered as constant above Мо = 6 and for perfect gas chosen to be cPs = 1.839. How large is the actual wall pressure (perfect gas) at the stagnation point, ps in terms of ро for Mо = a) 6, b) 8.03, c) 10 d) to? Discuss this result and quantify the excess pressure in the Edney type IV interaction case, Fig. 9.18.
Problem 9.3. How large is the Mach number normal to the shock wave, MON, of the hypersonic argon flat-plate flow at x (= x/Lsfr) = 2, Fig. 9.21? Are the flat-plate results acceptable?
Problem 9.4. Compute the interaction parameter and the rarefaction parameter V for the argon flat-plate flow at x (= x/Lsfr) = 1. Assume jargon ж T0’75. How large is xCT«?
Problem 9.5. Compute at x = 1 m the interaction parameter the rarefaction parameter V, and the critical length хсгц for the CAV data given in Table 7.9. Assume laminar flow, Tw = 1,500 K as wall temperature (hot wall), and pair ж T1165.
Problem 9.6. Compute at x = 1 m the interaction parameter the rarefaction parameter V, and the critical length хсгц for a CAV flying with Мо = 10 at 50 km altitude. Assume laminar flow, Tw = 1,500 K as wall temperature (hot wall), and use eq. (4.15) to determine pair.


