FLOW CHARACTERISTICS
The flow characteristics around a delta wing are influenced by. the leading edge angle, cross section shape and angle of attack. These characteristics determine the position and strength of a pair of vortices that start at the apex of the wing. The vortices formed are descri bed as leading-edge vortices and are located on the top surface of the wings, the core proceeding downstream 😮 the trailing-edge at an angle slightly greater than the heading – edge angle of sweep. Aft of the trailing-edge the vortices continue downstream in the direction of flow at a downwash angle proportional to the lift. These vortices exert a large influence on the lift characteristics of the delta wing, especially at the higher angles of attack.
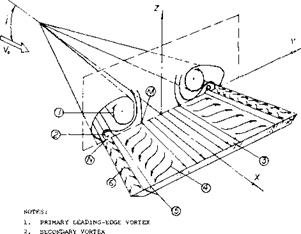
With the rolling-up process there is a strong lateral flow toward the edges as indicated in figure 3. A secondary separation and the formation of another small vortex is developed from this flow. The direction of rotation of this vortex is opposite to the main leading-edge vortex, figure
2. In the main leading-edge vortex there is a progressive reduction of the total pressure and increasing intensity of the edge vortex sheets with increasing angle of attack.
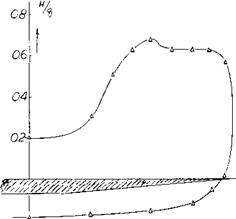
The pressure distribution across the span is shown in part (B) of figure 4. Most of the normal force is produced in the outer 1/2 or 2/3 of the semispan on the upper surface. This type of pressure distribution is influenced by the tip vortices as well as the normal circulation flow on the wing.
 Leading-Edge Vortices. The leading-edge vortices of delta wings have been observed and measured by several investigators (1). Many techniques including tuff surveys, oh film studies, condensation trail photographs and water tunnel studies have been used. Based on these observations the vortex flow pattern for a typical wing is illustrated in figure 3. Vortex sheets are shed off the leading-edges and blow back over the upper surface rolling up to form a pair of stable vortices. These vortices appear on top of the wing and increase in intensity downstream from the apex. By the time the vortex sheet reaches the wing trailing-edge it is fully developed. The pressure differential between the upper and lower surfaces causes the flow velocity and the formation of the leading-edge vortices. As would be expected the pressure difference increases with angle of attack with a resultant increase in the strength of the vortices. As the apex angle of the delta wing decreases, a reduction of aspect ratio, the tip vortices on either side will interfere. The tip vortices on the upper surface of the wing proceed downstream at a downwash angle corresponding to the lift of the wing until they break up.
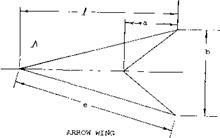
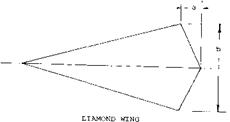
Figure 2. Characteristics of arrow and diamond shape delta wing modifications.
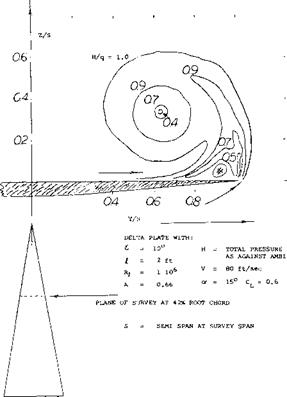
Flow Pattern. Details of the flow pattern around the edge of a slender delta wing operating at a 15 angle of attack were determined from (l, a) and are given in figure
3. The pressure survey at the 42% root chord show a strong flow around the edge of the wing due to the pressure difference between the upper and lower surface. The vortex sheet originating from the edge rolls up in a large single vortex core. This is basically the same type flow encountered with any other wing. The difference is due to the fact that the lateral edges are long in comparison to the span of the slender shape wings considered.
(1) The flow pattern of slender delta wings:
a) Fink, Experiments on Vortex Separation, R&M 3489.
b) Lee, Delta Wing Flow, ARC RM 3077 (1958).
c) Bird, Flow Visualization, NACA TN 2674 (1952) & TN D-5045.
d) Earnshaw, Structure of a Leading-edge Vortex, R&M 3281.
e) Peckham, Series of Uncambered Pointed Wings, R&M 3186.
f) Poisson-Quinton, Water Tunnel Visualization Vortex Flow, A. A. June 1967.
|
3- AXIAL FLOW INBOARD ON WING SURFACE 4. LATERAL FLOW 5„ TRANSITION 6. TIP FLOW |
Figure 3. Flow distribution of a sharp-edge delta wing showing
primary and secondary leading-edge vortices.
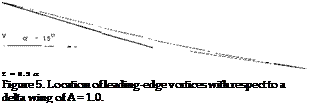
Vortex Pair. The pair of leading-edge vortices are located with respect to the wing as shown on figure 5. The height of the core above the wing increases with angle of attack, but the spanwise position decreases. Aft of the wing the core of the vortices achieves a downwash angle equal to approximately 0.5 or. Theory does not predict the location of these vortices with any accuracy (2).
angle of attack increases further, the bursting point moves toward the apex. Although the vortex core breakdown represents an abrupt increase of the core diameter with increased dissipation, it does not lead to a complete absence of vortex type flow. However, when the vortex bursting takes place at the wing trailing-edge, it can be expected that the vortex lift increment will decrease with further increases of the angle of incidence.
|
|
Vortex Breakdown. The leading-edge vortex remains stable along the wing surface and proceeds downstream until bursting takes place (3). At bursting the vortex becomes irregular and influences the flow pattern. With a further increase of angle of attack, the vortex bursting takes place on the wing starting at the trailing edge. As the [133]
|
Ы – 15° – 0.6 SURVEY AT 42% |
Figure 4. Pressure survey of flow pattern in the vicinity of the tip of a delta wing, including spanwise load survey.
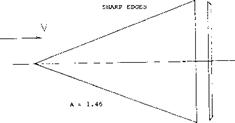
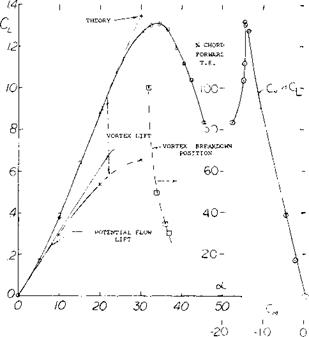
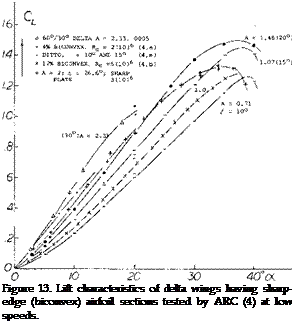
Lift Variation. The typical experiment results (4,h) of the variation of the lift and moment of a slender, sharp edge, flat delta wing is given on figure 6. As a result of the potential flow and vortex lift created by the vortices described above, the lift curve is non-line a]’ as is illustrated. The slope of the lift curve increases with angle of attack until vortex bursting takes place, after which a stall takes place with a corresponding reduction of lift. The angle and chordwise location for the vortex bursting is also given on figure 6. The vortex bursting was determined from flow observations. The slope of the moment curve is negative and linear up to the stall angle.
 The initial slope of the lift curve at zero angle of incidence represents the linear portion of the lift curve and is equal to the potential or circulation lift of the wing. This portion of the lift curve is the same as was observed in the case of low aspect ratio wings and can only be estimated at zero angle of attack from the experimental data. Above this angle the potential flow lift follows a sin cosa oC function indicated by theory as discussed in the next section.
The experimental lift curve shown in figure 6 also contains the component or lift which is produced by the leading-edge vortices. This lift component is referred to as vortex lift and follows an angle function corresponding to sin2 oL cos or until there is an apparent limit due to vortex breakdown. The vortex lift increment is illustrated on figure 6 and can be calculated for sharp-edged flat wings as shown in the next section.
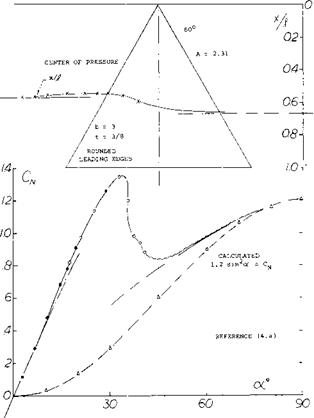
60 ° Delta Wings. The characteristics of a larger aspect
ratio delta wing are given on figure 7. This wing is a flat plate with rounded leading-edges with zero camber and A = 2.31. The results shown in terms of the normal force coefficient indicate a maximum lift at ot = 33° dropping to a value of.88 at or = 45° .
Lift to oC = 90°. The lift coefficients as in figure 7 sooner or later reach maximum values beyond which the flow separates from the suction side. However, as shown, after an appreciable drop there is still lift at angles of attack between 20 and 40° corresponding to lift coefficients between 0.7 and 0.8. Lift at still larger angles, to 90° , is the result of pressure at the lower side of negative pressure within the separated space at the upper side and as a consequence of some circulation. This type of flow pattern in larger A’ratios at larger angles of attack, characterized by an alternating vortex street, is different from the cross-flow type described above. Basically, we may consider lift at angles near 90° to be a component of pressure drag. To estimate the variation of lift and normal force to or = 90° we assumed, therefore, that = CD = 1.2 (for a flat plate) and reduces as the function 1.2 sin2or. The normal force variation for the entire wing is given for the range based on this variation. At intermediate angles (between 30 and 60°) there is evidently some additional component of lift, other than that due to drag, due to circulation and to deflection of the flow field including the viscous wake.
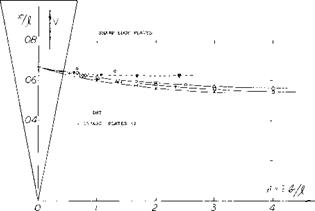
The history of lift (or normal force) is reflected in the center of pressure point, shown in the upper part of the graph. The center of pressure is first located at x/J? = 0.56 or 0.57. On account of the non-linear component, the point moves forward as far as to 0.54 of the chord. At ot =90 , the center of pressure will necessarily be at
the geometric center of the delta plate, at 2/3 of the length. As the “wing"’ stalls (between 30 and 40^ ) the pressure point moves aft, roughly 10% of the length of the plate.
3. ANALYTICAL ANALYSIS
|
|
|
Figure 6. Typical variation of lift and moment coefficients of a sharp-edge delta wing, including vortex bursting location. |
The theory for calculating the lift characteristics of delta wings has received considerable attention (2) without the development of an exact solution. The difficulty appears to be the determination of the location of the leading edge vortices. Further, problems due to separation such as might be developed about a round edge, further complicates finding an exact solution. A procedure has been developed, however, for calculating the potential flow and vortex lift components for sharp edge flat plate delta wings. This procedure (5,a, b,c, d) is based on a leading edge suction analogy and is very effective for finding the lift components. Although it is limited to sharp edge type wings this procedure will be used as a basis for determining the lift of delta type wings. The effects of changes due to planform shape, edge radius, flaps, control devices and bodies not considered by the leading-edge suction analogy are then determined based on experimental data.
|
|
Figure 7. Characteristics of a larger aspect ratio delta wing to high angles of attack.
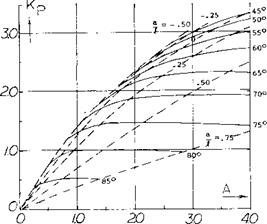
 Since К p is dependent on the planform it has been found by a suitable lifting-surface theory (5,3) as a function of aspect ratio for delta, arow and diamond shape wings and is given on figure 9. The lift coeeficient due to potential flow is then calculated using equation 1 and a value of К p from figure 9, which depends on the planform of the wing.
|
|
|
|
|
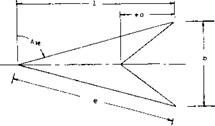
Potential Flow Lift. The potential flow lift component
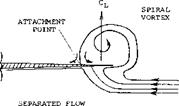
of sharp edge wings is determined assuming no leading edge suction can be developed, since a Kutta type condition is assumed to exist (5,a), figure 8. It is further assumed that the flow reattaches downstream of the leading edge vortex. Although the potential flow lift is reduced by the assumed loss of leading-edge suction, which should be changed to the vortex lift term, it is retained for convenience. Without leading-edge suction the resultant force for plain wings is the potential flow wing normal force which depends on the strength of the circulation. The strength of the circulation about the lifting surface requires the velocity normal to the wing induced by the complete vortex system to be equal to V sin of The velocity of the flow is thus parallel to the wings satisfying the Kutta condition at the trailing edge. By this method a coefficient Kp is determined which is related to the potential flow lift coefficient CLP by
CL ~ К p sinof COS Q’ (1)
Equation 1 becomes for small angles
CL = Kpof; dCL/dtf = .0174Kp (2)
Figure 9. Potential flow lift constant as a function of planform parameters
(5) Theoretical Analysis:
a) Polhamus, Vortex Lift Based on Leading-edge Suction Analogy, NASA TN D-3767.
b) Polhamus, Application of Leading-edge Suction Analogy for Delta Wings, NASA TN D4739.
c) Polhamus, Charts for Predicting Characteristics of Delta Wings, NASA TN D-4739.
d) Polhamus, Predictions of Vortex-Lift by Leading-edge Suction Analogy, J of Aircraft, April 1971.
(6) Experimental investigation of “parabolic” planforms:
a) Peckham, Series of Pointed Wings, ARC R&M 3186.
b) Spencer, Series of Planforms, NASA TN D-1374 (1962).
c) Kirby, “Thin Slender Wings”, Letter report to Hoerner.
Vortex Lift. The flow developed by the leading-edge vortices on the top surface of the wings results in the development of the vortex lift component of lift. This lift component is generated by the downward momentum produced by the flow over the wing leading-edge from the pair of counter-rotational vortices above the wing, as is illustrated on figure 3. The suction peaks associated with the leading edge vortices give an increase in the lift curve slope with incidence and so causes the characteristic non-linear lift curve of slender delta type wings.
Theory. There have been many attempts to develop a theory for calculating the position of the leading-edge vortices on a wing and their effect on lift (2). These efforts have generally failed so that correlation with test data is poor. As in the case of low aspect ratio wings, the non-linear lift has been analyzed on basis of a drag based on the flow normal to the wing. This concept results in a lift increment equal to
CL = CDsin2cx cos a (3)
where Cq is the drag coefficient of the wing operating at an angle of attack equal to 90 . Fairly good correlation of test data is obtained with this procedure as indicated in conjunction with figure 7, Chapter XVII. However, at the lower angles of attack it appears that this is not the correct concept for calculating the change in lift due to the vortex flow of delta wings.
Leading-edge Suction Analogy. With the assumption of the leading-edge analogy (5,a, b,c, d) a procedure was developed that can be used to calculate the vortex lift increment. This method was developed for sharp edge delta type wings. The leading-edge suction analogy depends on the assumption that the thrust due to suction produced by the vortex in front of the wing is the same as that produced by the vortices on top of the wing. Thus, the vortices needed in the theoretical solution are not real in the sense of their location, since the experimental results show they are located on top of the wing, figure 3. By assuming that the thrust or suction force produced by the vortices is the same as produced by the actual vortices on the wing, lift increment is calculated by the equation
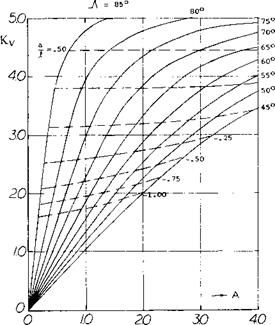
CL = sinz of cos of (4)
The value of Kv was developed in (5,a) for delta type, arrow and diamond planform wings with sharp edges and zero camber and is given in figure 10.
The value of К v for plain delta wings is approximately equal to Tf. This is considerably above any drag coefficient that might be expected for a delta wing operating at an angle of attack of 90°. It would, therefore, appear that the concept of drag is not valid for predicting the non-linear lift term of delta wings.
The calculated vortex and potential flow lift using equations 2 and 4 agree closely with measured values up to 20 as illustrated in figure 6. This correlation is typical for slender type flat delta wings with sharp edges which the theory assumes. Because of this excellent correlation a base is available for evaluating changes due to leading-edge radius, camber, flaps, control devices and bodies.
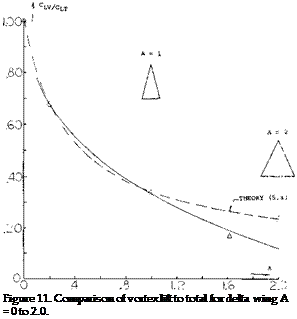
Vortex Lift to Total Lift. The vortex lift becomes the primary component as the sweep angle or slenderness of the wing is increased. This is illustrated by the data of figure 11 that shows the lift ratio as a function of aspect ratio.
|
|
Figure 10. Kv plot vortex-lift constant as a function of planform parameters.
 |
 |
Delta-Low Aspect Ratio Wing Analysis. The large difference shown in the value of in comparison to C q was not obtained with low aspect ratio wings, Chapter XVII. This could be due to the change in the potential lift curve between delta and low aspect ratio wings. The potential lift term determined for low aspect ratio wings is much higher than that for delta wings. Thus, the component due to the vortex flow is lower as determined from the experimental data for low aspect ratio wings. Since the potential flow can only be estimated from the test data, the question cannot be resolved. For this reason it is necessary to separate the analysis of the two types of wings until a more unified theory is developed.
|
Figure 12. Aerodynamic center of delta wings derived from experimental results. |
The Aerodynamic Center. The chordwise position where the coefficient of the pitch moment is constant, aerodynamic center, is theoretically:
at x/c = 0.25, in foil sections or straight wings
at x/jf =2/3, in slender delta wings.
Considering a delta wing to be a swept and highly tapered shape, a mean aerodynamic chord can be found using figure 2 of the first “longitudinal” chapter. As mentioned in connection with figure 1, this chord would be c = (2/3)X. In aspect ratios approaching zero, in very slender delta wings, the theoretical position of the aerodynamic center at x – (2/3) } , corresponds to 0.5 c, rather than to 0.25 c as in large A’ratios. However, we will refer the position of the center to the length j} of the delta wings considered,. Experimental results evaluated from dCm,/dCL slopes at small angles of attack (around zero lift) are plotted in figure 12. Assuming that the position, say at A = 10, would be close to x/j? = 0.5, it is seen moving toward the trailing edge as the A’ratio is reduced. All of the series of wings and plates investigated seem to approach the 2/3 position as their aspect ratio approaches zero. The limit up to which delta wings would
actually be used may be A = 2 (where $ /b = 1). In this planform shape, profiled (and round-edged) wings show positions х/л = 0.59. By comparison, flat plates have a more forward position, namely at 56% of the length (at A = 2).


