Our heavyweight helicopter equal in the world does not have
In Rostov started production of the most load-lifting rotary-wing car The Russian holding «Helicopt[...]

Everything about aircrafts and helicopters. News and events in aviation worldwide. Civil, transportation, military helicopters and airplanes.

Everything about aircrafts and helicopters. News and events in aviation worldwide. Civil, transportation, military helicopters and airplanes.

Everything about aircrafts and helicopters. News and events in aviation worldwide. Civil, transportation, military helicopters and airplanes.

Everything about aircrafts and helicopters. News and events in aviation worldwide. Civil, transportation, military helicopters and airplanes.


A key part in the process of assessing the response of helicopters to the vortices of fixed – wing aircraft is the development of severity criteria for the encounters. Severity criteria based on handling qualities analysis link directly with the central thrust of this book. The results presented here are drawn from the author’s research with colleagues (Ref. 8.53-8.56), which was initially aimed at developing safety cases for the positioning of final approach and take-off areas (FATO) at airports. The work has since expanded to inform the development of operating procedures for runway-independent aircraft (Ref. 8.56), hence assisting the timely expansion of vertical flight aircraft operations, both helicopters and tilt rotor aircraft, to and from busy hubs.
The wake vortex
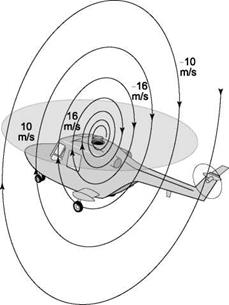
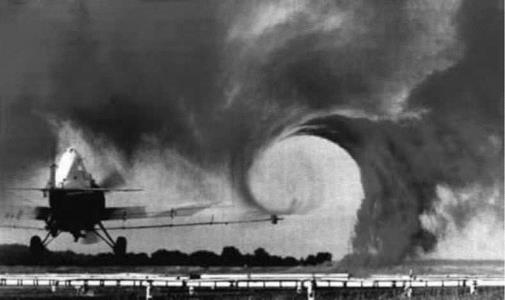
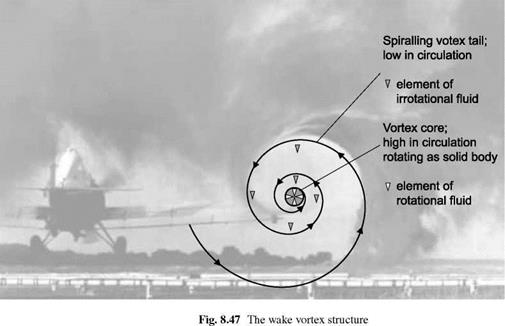
Wake vortices are an extension of the so-called bound vorticity of a lifting surface, shed from the wing tips as distinct vortex structures and rolling up with the span-wise shed vorticity into a counter-rotating pair. The resulting flow structure descends in the mean downwash from the wing, moves laterally with any horizontal wind and eventually breaks up as the inner core, kept together almost as a solid body by strong viscous forces, becomes unstable. Both fixed – and rotary-wing aircraft leave a vortex wake behind, dissipating the energy required to maintain the aircraft aloft. Figure 8.47 illustrates the flow topology in the tip vortex.
The velocity in the vortex core increases linearly with radial location from the centre, the fluid rotating effectively as a solid body. The flow here is ‘rotational’ so that elements of fluid rotate as they are drawn around in a circular pattern (see the white triangular fluid elements in Fig. 8.47). Outside the core, the flow is largely irrotational and the velocity decreases with distance from the core centre. An element of fluid would be drawn into the vortex from the surroundings, and would move toward the centre along a spiralling streamline, without rotation (the decreasing velocity with radius allows this to happen – see the grey fluid elements in Fig. 8.47) until reaching the outer edge of the core. The manner in which the rotational core is fed with irrotational fluid and the 3-dimensional development of the vortex, both radially and streamwise, has been the subject of aviation research for decades (see Ref. 8.57 for ‘… a consolidated European view on the current status of knowledge of the nature and characteristics of aircraft wakes…’). For the purposes of this analysis a rather simple model of the vortex structure is used and will be described following an appraisal of the severity criteria in handling qualities terms.
 |
 |
Hazard severity criteria
The definition of a hazard set out in the SAE’s Aerospace Recommended Practice ARP4761 (Ref. 8.40) is ‘a potentially unsafe condition resulting from failures, malfunctions, external events, errors or a combination thereof’. In busy airspace, aircraft are regularly exposed to the risk of experiencing unsafe conditions through wake-vortex
encounters (Ref. 8.58). Separation is designed to minimize this risk, but the risk is ever present, and its ‘acceptability’ is a function of the severity of the disturbance and the probability of occurrence. Generally, severe disturbances must be improbable and as the level of severity decreases, the frequency of occurrence can increase for the same risk. This critical relationship underpins aviation safety and system design.
There are two main concerns and related questions regarding disturbance severity:
(a) Does the disturbed aircraft have sufficient control margin for the pilot to overcome the disturbance?
(b) Can the disturbance transient lead to an unsafe flight condition if not checked within a reasonable pilot intervention time, in terms of collision with surfaces, exceedance of flight envelope, risk of pilot disorientation or loss of control?
The detailed answers to these questions lie in understanding the nature of the response of the aircraft to a vortex disturbance. In handling qualities terms, the response characteristics of immediate interest relate to the moderate to large amplitude criteria – quickness and control power (see Chapter 6). To recap, the control power is the amount of response achievable with the available control margin; the response quickness is the ratio of peak attitude rate to attitude change in a discrete attitude change manoeuvre. Quickness is inversely related to the time to change attitude and will be affected by roll/pitch damping, actuator limits and, to an extent, static stability effects, e. g., how much and in what sense sideslip or incidence changes occur during the manoeuvre.
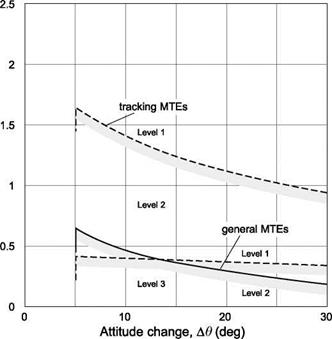
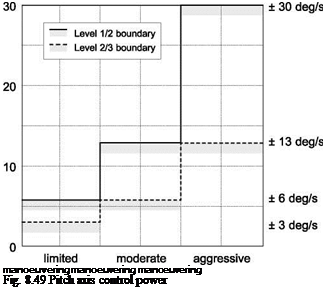
The sufficiency of attitude control margins in terms of quickness (for pitch manoeuvres up to 30°, roll up to 60°) and control power (for pitch manoeuvres >30°, roll >60°) is of primary concern. Reference 8.53 highlighted that the initial disturbance to an encounter with a vortex, aligned in the same direction as the helicopter (parallel encounter), will be in pitch. The non-uniform (lateral) incidence distribution imposed on the rotor disc by the vortex in a parallel encounter has a similar effect to the application of longitudinal cyclic pitch, the flapping response occurring 90° later to give pitch up/down moments. This is in contrast to the rolling moment disturbance experienced by fixed-wing aircraft following a parallel encounter. Figures 8.48 and 8.49 show the MTE-dependent pitch axis quickness and control power criteria boundaries for low-speed/hover tasks according to ADS-33 (Ref. 8.3, also Section 6.4).
A helicopter flying into the irrotational ‘tail’ of the vortex wake will experience a more uniform incidence distribution across the rotor disc, leading to thrust and power changes. In the heave axis, the corresponding Level 1 response criteria are defined in terms of control power (minimum of 160 ft/min, 1.5 s after initiation of rapid displacement of collective control from trim) and vertical rate time constant (t63% < 5 s). These correspond approximately to a hover rate of climb performance of 650 ft/min with a 5% thrust margin. Level 2 performance is obtained with a minimum climb rate of 55 ft/min and Level 3 with 40 ft/min. These values are relatively low and it can be appreciated that a general downwash of magnitude about 10 ft/s would nearly swamp the Level 1 performance margin. An aircraft should possess at least the Level 1 performance standards described above for the pilot to be able to fly moderately aggressive low-speed manoeuvres with precision and low compensation. The question arises as to whether an aircraft designed to meet the ADS-33 performance standards will have sufficient margin for the pilot to overcome the effects of a vortex encounter. The second issue listed above concerns the aircraft motion transients in response to the vortex encounter, and this will be addressed using the same methodology described for
![]()
|
|
|
 Minimum
achievable
pitch rate
(deg/s)
control system failures. ADS-33 sets requirements for the response to system failure transients in the form of Table 8.7 presented earlier in this chapter.
The focus in the study described in Ref. 8.55 was the severity of encounters for rotorcraft flying in hover and low speed (<45 knots), including low-speed climbs. The main concern is with the first column in Table 8.7, and particularly the Level 2/3 boundary, on the basis that this differentiates between safe and unsafe conditions. The Level 2/3 boundary corresponds to a transient that would result in a displacement of the aircraft of about 20 ft (6.1 m), with a velocity of about 20 ft/s (6.1 m/s) and angular rate of 10°/s, after 3 s. A question that arises when expressing the encounter transients using these criteria is – what should the pilot intervention time be? The 3 s in ADS-33 corresponds to a scenario of a single pilot attending to other mission duties while in hover with auto-hover engaged. In the UK Defence Standard (Ref. 8.42) this would correspond to passive hands-on operation. For attentive hands-on operation, the pilot response time is 1.5 s according to Ref. 8.42, following control system failures. In the US civil certification standards (Ref. 8.59) the response time (for hover operations) is set at the normal pilot recognition time (0.5 s). However, a strong argument could be made for increasing this to 1.5 s in divided-attention situations or when operating with auto-hover engaged.
To address the two questions posed above, a series of piloted simulation trials using the facility at The University of Liverpool (see Appendix 8A) was carried out. The modelling and simulation environment used in the studies was FLIGHTLAB and the HELIFLIGHT motion simulator (Ref. 8.60). The two aircraft featured in the study were the Westland Lynx and the FLIGHTLAB Generic Rotorcraft (FGR), configured as a UH-60 type helicopter. Key configuration parameters of the two aircraft are given in Table 8.9.
The aeromechanics modelling features are summarized in the following:
• blade element rotor with look-up tables of quasi-steady, nonlinear lift, drag and pitching moment as functions of incidence and Mach number (five equi-annulus segments),
• FGR – four rigid blades with offset flap hinge; Lynx – four elastic blades with first three coupled modes,
• three-state dynamic inflow model,
• Bailey disc tail rotor with S3 coupling,
• three-state turbo-shaft engine/rotorspeed governor (rotorspeed, torque, fuel flow),
• look-up tables of fuselage and empennage forces and moments as nonlinear functions of incidence and sideslip,
• rudimentary quasi-steady interference between rotor wake and fuselage/empennage,
|
Table 8.9 Helicopter parameters in the vortex encounter study
|
basic mechanical control system with mixing unit and actuators plus limited-authority stability and control augmentation system (SCAS – rate damping with attitude control characteristics at small attitudes in Lynx), rudimentary three-point undercarriage.
This level of modelling is generally regarded as medium fidelity, capable of capturing the primary trim and on-axis responses within about 10% of test data. Handling qualities parameters are also reasonably well predicted by this modelling standard. A variety of empirical models have been used to describe the tangential velocity profile of a tip vortex. Two commonly used examples are the ‘Dispersion’ model (Ref. 8.61) and the ‘Burnham’ model (Refs 8.62, 8.63); the Dispersion model takes the form
where Vt (r) is the tangential velocity at a distance r from the vortex core, rc is the core radius (defined as the distance from the centre of the vortex to the peak of the tangential velocity) and Г is the total circulation around the vortex (with units of m2—s-1).
The Burnham model takes the form
Vt (r) = Vc (r/rc), |r |< rc
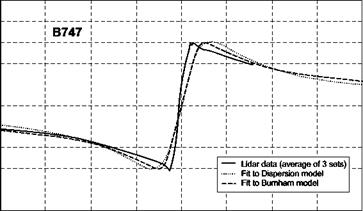
where Vt (r) and rc are as defined previously, and Vc is the peak velocity, i. e., the value of Vt (r) at the edge of the rotational core, r = rc. These vortex models are compared to LIDAR (Coherent Laser Radar) measurements of the tangential velocities in the (young) vortex wake of a Boeing 747 in Fig. 8.50 (Ref. 8.54). A best fit was obtained for the velocity profiles of several aircraft types, and the resulting parameters are given in Table 8.10.
 Tangential 25 velocity (m/s) 20
15
10
5
0
-5
-10
-15
-20
-25
-20 -10 0 10 20
Distance from core (m)
|
Table 8.10 Best fit parameter values to LIDAR velocity profiles for the Burnham and dispersion models (Ref. 8.54)
|
As discussed in Ref. 8.54, the parameter values for the larger aircraft (Boeing 747, Airbus A340) should be reliable, but the maximum velocities for the medium twin engine aircraft (Boeing 757, Airbus A310) are estimates, which will be equal to or less than the true value, as the LIDAR sensitivity was insufficient to detect the peak.
In the study, the encounters occur when the vortex is at the (full) strength. Vortices do decay with time and the decay rate is a function of prevailing wind, humidity and wing flap configuration. The results presented therefore probably represent worse – case scenarios and the encounter effects in a real scenario may differ considerably. Key assumptions are that the vortex flow-field is unaffected by the rotorcraft and is superimposed on the quasi-steady incidence changes on the rotor. These assumptions are clearly open to question, but there is little reliable information on the interactional effects and they are likely to be very complex, particularly if the rotor blade cuts through the vortex core.
The velocity field of a Boeing 747 vortex when centred at the rotor hub is sketched in Fig. 8.51. Note that, at the rotor tips, the downwash/upwash is still considerable
|
|
(12 m/s, 39 ft/s), and with a rotor tip speed of about 220 m/s (720 ft/s) the perturbation in incidence is approximately 3°. This cyclic variation in incidence will result in longitudinal, forward, flapping of the rotor blades and a nose-down pitch moment for the anti-clockwise rotors on the Lynx and FGR.
A similar rationale can be applied to the perturbations in heave velocity. In this case the greatest disturbances are experienced when the rotorcraft is in the vortex tail, close to the core. The cyclic stick and collective lever margins available to the pilot to negate the effects of the vortex depend on trim position of the controls.
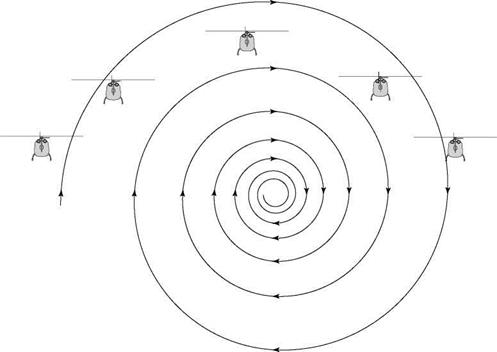
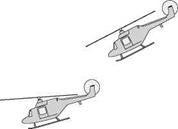
The technique of constrained simulation was used extensively in the study described in Refs 8.53-8.55 to ensure that the rotorcraft-vortex encounters have predictable initial conditions. Also, it proved more convenient and tractable to fix the position of the vortex in space and to move the aircraft laterally at different encounter velocities through the tails and core. As described in Ref. 8.53, with unconstrained simulations it was found that as the vortex approached the aircraft at the same height the aircraft would be lifted up in the approaching tail of the vortex and carried over the top and down in the following tail, as shown in Fig. 8.52.
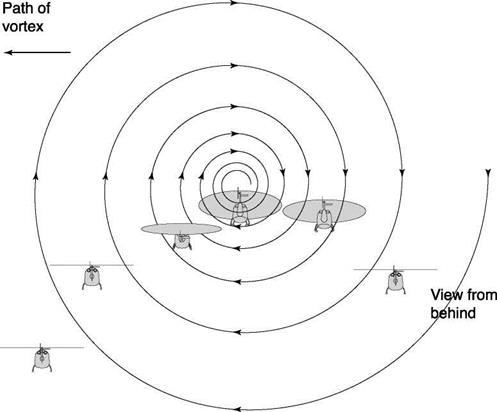
In contrast, Fig. 8.53 illustrates the case when the initial position of the helicopter was such that an encounter with the vortex core was forced to occur. This scenario is not unrealistic as the vortex wakes tend to remain at about a semi-span (of the fixed-wing aircraft) above the ground. Hence, to avoid the complications of having to set different initial conditions for the different helicopters, vortex wakes and encounter speeds and to ensure that worst-case scenarios are explored, the constrained simulation approach was adopted. The initial condition was with the rotorcraft positioned 100 ft (~30 m)
![]()
|
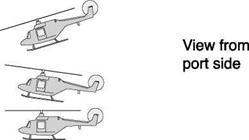
to the port side of the (port wing) vortex, simulating an encounter with a vortex shed from an aircraft taking off to starboard of the rotorcraft.
In the following section, results are presented for two cases: (i) with constrained vertical/forward motion and heading to explore pitch attitude perturbations as the core is encountered and (ii) with constrained attitude, heading and forward motion to explore heave perturbations as the tails are traversed. Both Lynx and FGR have been investigated, with and without their SCAS engaged, although only results with SCAS – on are presented as this will be the normal configuration. Encounters with the vortex wake of the Boeing 747 are shown; Ref. 8.54 presents comparisons of encounters with the different aircraft mentioned in Table 8.10.